Graph Application using Vitis Accelerated Libraries
This lab walks you through the steps to create a Vitis design with one kernel Single Source ShortestPath leveraging Vitis Graph Library available in the Vitis Accelerated Libraries.
Objectives
After completing this lab, you will be able to:
- Use Vitis from command line
- Modify source files to target Amazon AWS FPGA board
- Compile kernels to Xilinx objects (
*.xo) - Build FPGA binary file from
*.xofiles - Compile host code to object files (
*.o) - Build executable host code, which includes linking
*.ofiles with dynamic libraries
Steps
Clone Vitis Accelerated Libraries repository
Clone the open source Vitis Accelerated Libraries repository in your home directory, if it is not already cloned
git clone https://github.com/Xilinx/Vitis_Libraries.git -b v2021.1_rel --depth 1 ~/Vitis_Libraries
Modify some source files and set environment variables
-
Navigate to the root directory of the example,
shortest_path_unweighted_predavailable as part of the repositorycd ~/Vitis_Libraries/graph/L2/tests/shortest_path_unweighted_pred -
Since the source files are targeting Alveo U50 card which has HBM, whereas Amazon AWS FPGA card does not and the Amazon AWS FPGA card is not an Alveo card. Some modifications will have to be done
To apply the modifications using the provided patch file run the following command
patch -s -p0 < ~/xup_compute_acceleration/sources/graph_lab/graph.patchThis patch a) sets the AWS-F1 platform as default, b) specifies to use DDR memory (instead of HBM) and c) enables profiling as well as debug
-
Copy
xrt.inicp ~/xup_compute_acceleration/sources/graph_lab/xrt.ini .This file specifies the information XRT will collect at runtime, such as trace and summary
-
Check
PLATFORM_REPO_PATHSRun the following command, if the return is empty refer to Lab Setup to setup
PLATFORM_REPO_PATHSecho $PLATFORM_REPO_PATHS -
Set Vitis Libraries path
We also need to define a path to the Graph library’s L2 directory
export VITIS_LIBS=~/Vitis_Libraries/graph/L2/include
Software Emulation verification
-
Compile kernels for the Emulation-SW using Makefile
make build TARGET=sw_emuThe kernel will be compiled and device binary file (shortestPath_top.xclbin) will be built under the
build_dir.sw_emu.xilinx_aws-vu9p-f1_shell-v04261818_201920_2 -
Compile the host application for the Emulation-SW using Makefile and run the application
make run TARGET=sw_emuThe host application (host.exe) will be compiled under the
build_dir.sw_emu.xilinx_aws-vu9p-f1_shell-v04261818_201920_2. The application will then be run producing the result similar to:---------------------Shortest Path---------------- id: 92 max out: 13 Found Platform Platform Name: Xilinx Info: Context created Info: Command queue created Found Device=xilinx_aws-vu9p-f1_shell-v04261818_201920_2 INFO: Importing build_dir.sw_emu.xilinx_aws-vu9p-f1_shell-v04261818_201920_2/shortestPath_top.xclbin Loading: 'build_dir.sw_emu.xilinx_aws-vu9p-f1_shell-v04261818_201920_2/shortestPath_top.xclbin' Info: Program created Info: Kernel created kernel has been created kernel start------ kernel call success kernel call finish kernel end------ ============================================================ Info: Test passedNotice that the application uses three parameters: -o, -c, -g requiring offset, indices weights, and golden data respectively. These files are provided in the
datadirectory under the project directoryNotice that
xclbin.run_summaryfile is generated based on the settings in thexrt.inifile -
Start
vitis_analyzerby executingvitis_analyzer xclbin.run_summaryVitis Analyzer shows Summary, Run Guidance, Profile Summary and Timeline Trace tabs on the left-hand side. Click Profile Summary
-
Click on the
Profile Summaryon the left and then click Kernels & Compute Units on the right to see kernel and compute units execution times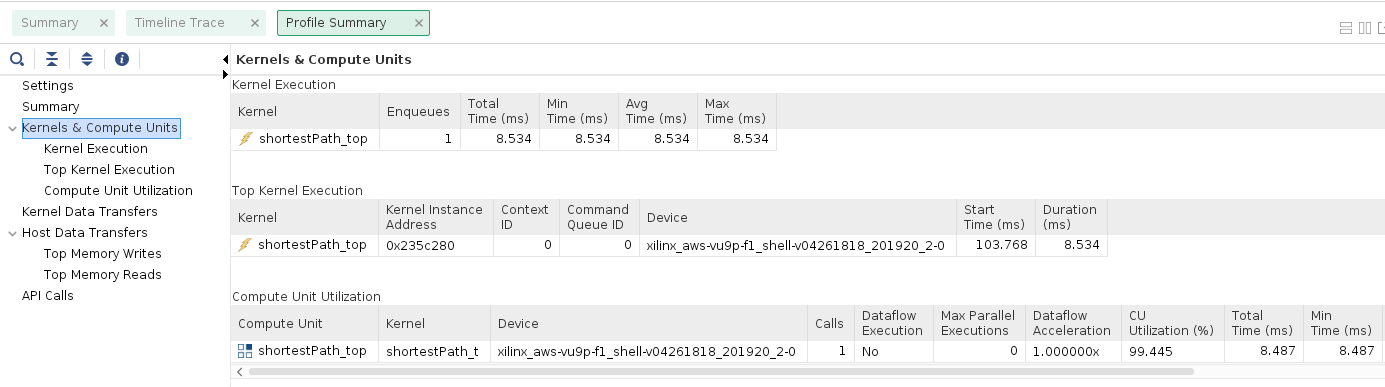
-
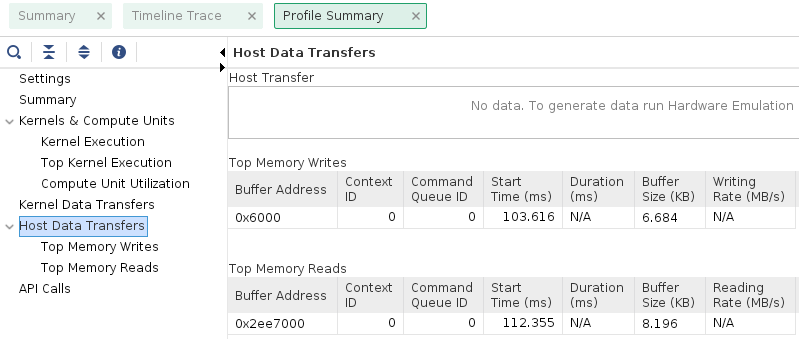
Click Host Data Transfer on the right to see read and write buffer sizes, buffer addresses, and the related execution parameters
-
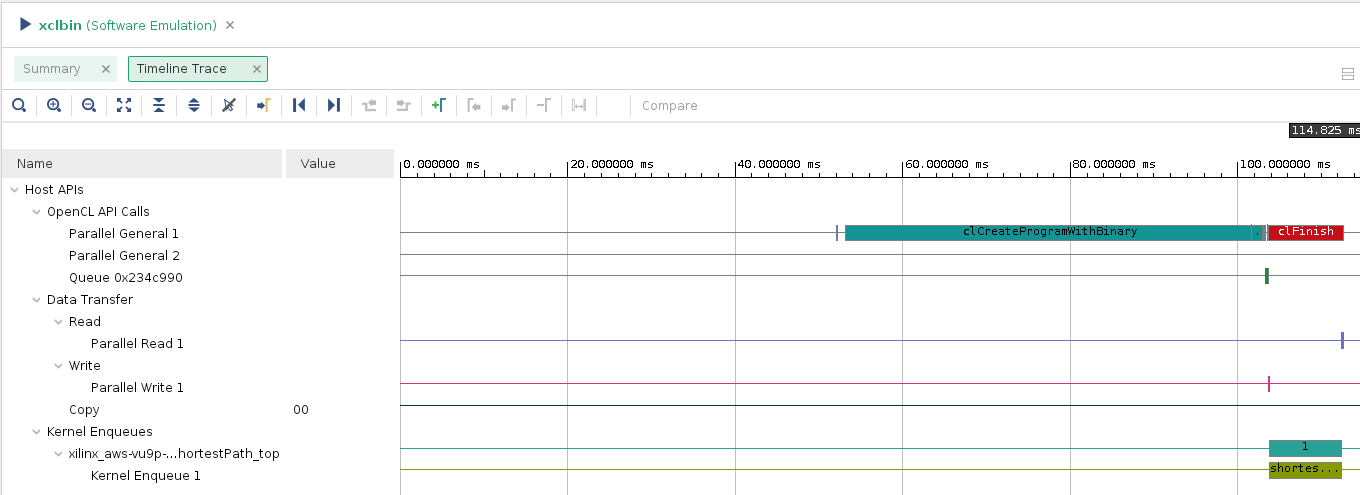
Select the
Timeline Tracepanel on the leftObserve the various events at different time intervals
-
When finished, close the analyzer by clicking
File > Exitand clicking OK
Hardware Emulation verification
-
Compile kernels for the Emulation-HW using Makefile
make build TARGET=hw_emuThe kernel will be compiled and device binary file (shortestPath_top.xclbin) will be built under the
build_dir.hw_emu.xilinx_aws-vu9p-f1_shell-v04261818_201920_2 -
Compile the host application for the Emulation-HW using Makefile and run the application
make run TARGET=hw_emuThe host application (host.exe) will be compiled under the
build_dir.hw_emu.xilinx_aws-vu9p-f1_shell-v04261818_201920_2. The application will then be run. Notice that Vivado simulator is opened and simulation waveforms are generated, and the application producing the result similar to:---------------------Shortest Path---------------- id: 92 max out: 13 Found Platform Platform Name: Xilinx Info: Context created Info: Command queue created Found Device=xilinx_aws-vu9p-f1_shell-v04261818_201920_2 INFO: Importing build_dir.hw_emu.xilinx_aws-vu9p-f1_shell-v04261818_201920_2/shortestPath_top.xclbin Loading: 'build_dir.hw_emu.xilinx_aws-vu9p-f1_shell-v04261818_201920_2/shortestPath_top.xclbin' INFO: [HW-EMU 01] Hardware emulation runs simulation underneath. Using a large data set will result in long simulation times. It is recommended that a small dataset is used for faster execution. The flow uses approximate models for Global memories and interconnect and hence the performance data generated is approximate. configuring penguin scheduler mode scheduler config ert(0), dataflow(1), slots(16), cudma(1), cuisr(0), cdma(0), cus(1) Info: Program created Info: Kernel created kernel has been created kernel start------ kernel end------ ============================================================ Info: Test passed INFO::[ Vitis-EM 22 ] [Time elapsed: 1 minute(s) 36 seconds, Emulation time: 0.260477 ms] Data transfer between kernel(s) and global memory(s) shortestPath_top:m_axi_gmem0-DDR[0] RD = 1.500 KB WR = 0.000 KB shortestPath_top:m_axi_gmem1-DDR[0] RD = 6.625 KB WR = 0.000 KB shortestPath_top:m_axi_gmem2-DDR[0] RD = 0.000 KB WR = 0.000 KB shortestPath_top:m_axi_gmem3-DDR[0] RD = 0.500 KB WR = 5.812 KB shortestPath_top:m_axi_gmem4-DDR[0] RD = 20.625 KB WR = 9.875 KB shortestPath_top:m_axi_gmem5-DDR[0] RD = 0.000 KB WR = 9.812 KB INFO: [HW-EMU 06-0] Waiting for the simulator process to exit INFO: [HW-EMU 06-1] All the simulator processes exited successfully -
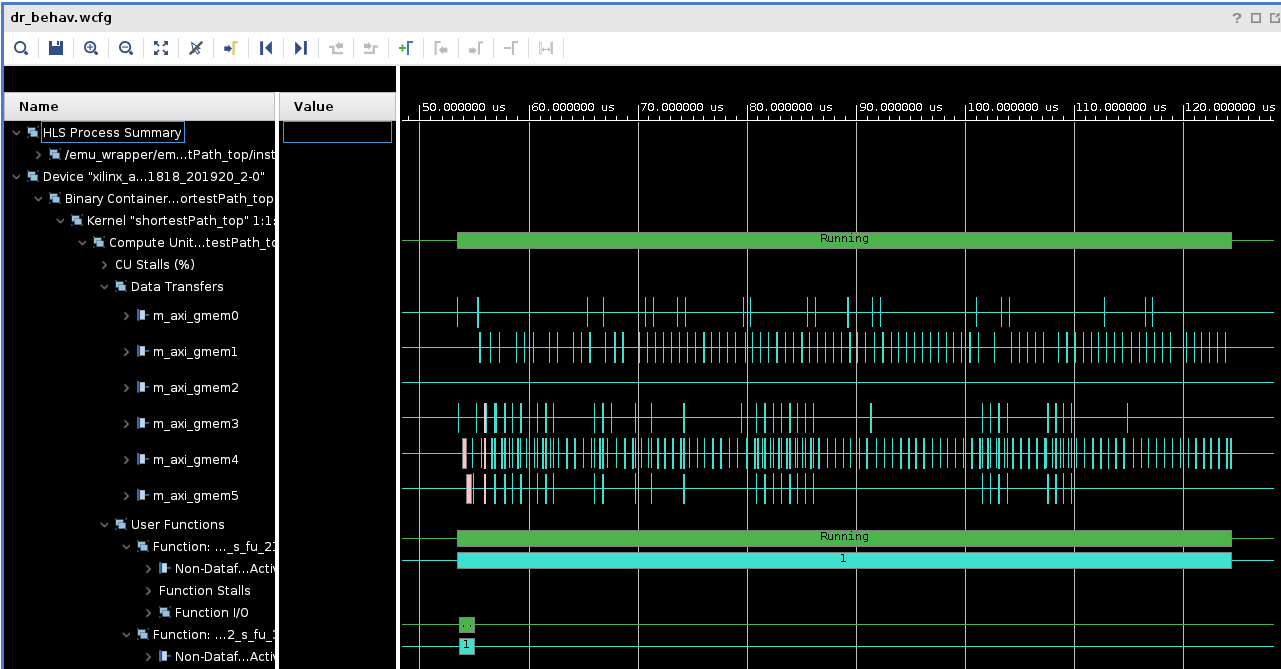
Click on the Full zoom button in the simulator window. Select the area of interest by left clicking on the start of the area of interest and dragging mouse to the end of the area of interest
Observe the kernel executes between 52 us to 122 us and data exchange activities on various memory banks
-
Close the simulator output by selecting File > Exit in the Vivado window
-
Start
vitis_analyzerby executingvitis_analyzer xclbin.run_summaryVitis Analyzer shows Summary, System Diagram, Run Guidance, Profile Summary, Waveform and Timeline Trace tabs on the left-hand side
-
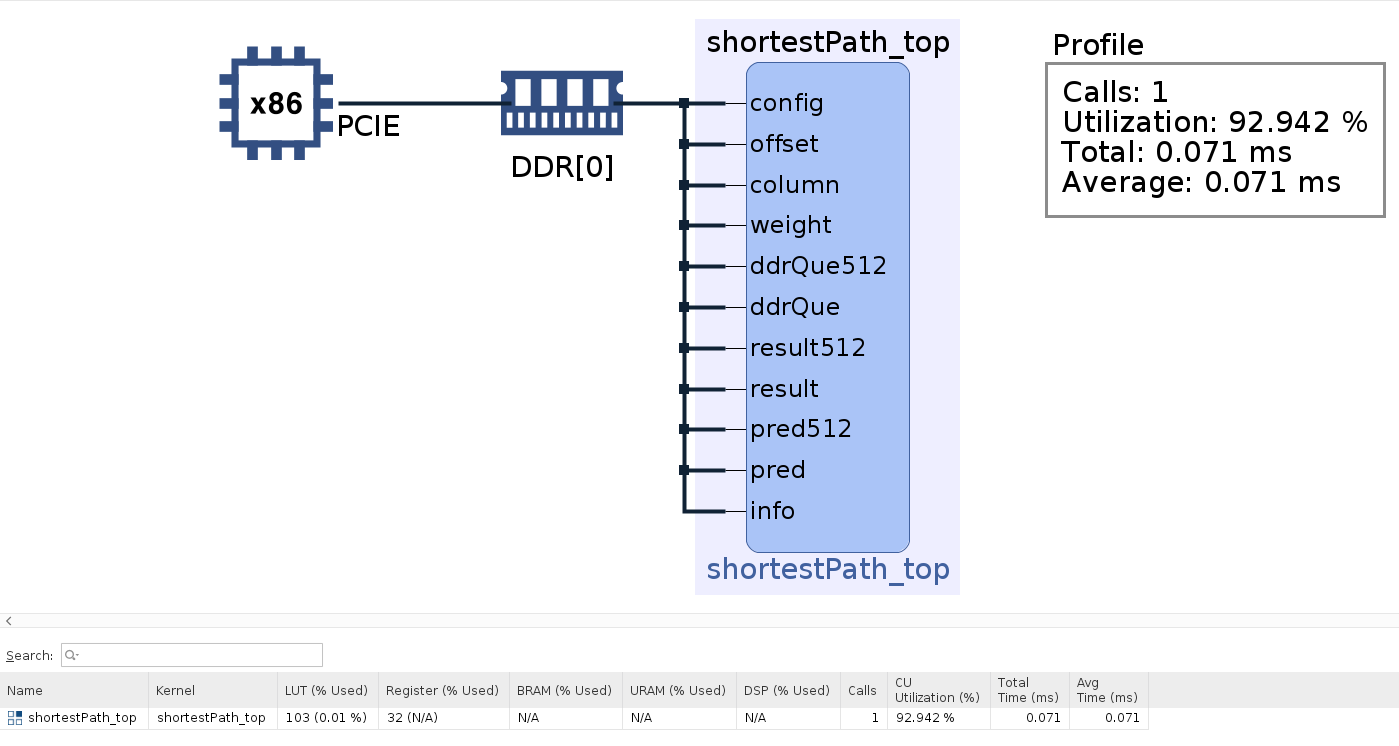
Click System Diagram and observe that all parameters are targeting DDR[0] bank
-
Click on the
Profile Summaryon the left and then click Kernels & Compute Units on the right to see kernel and compute units execution times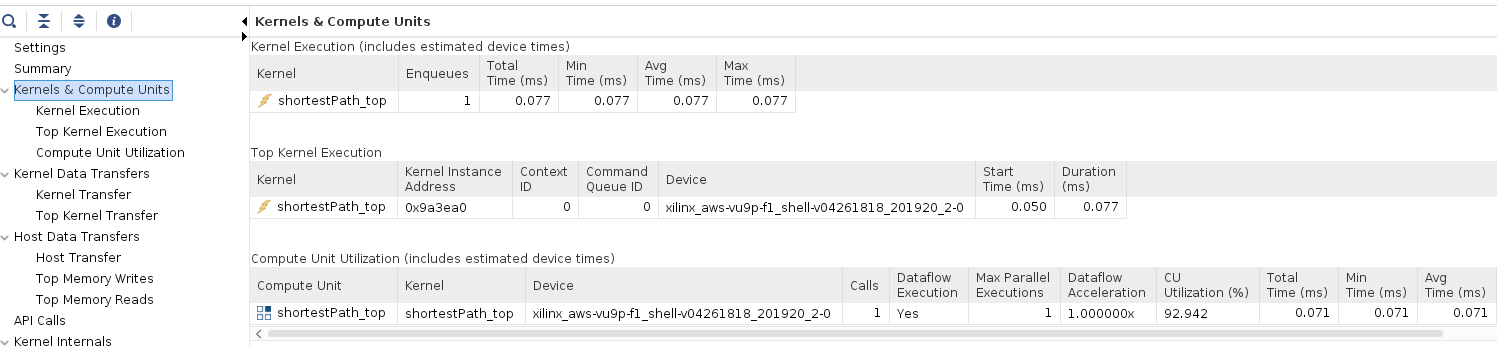
-
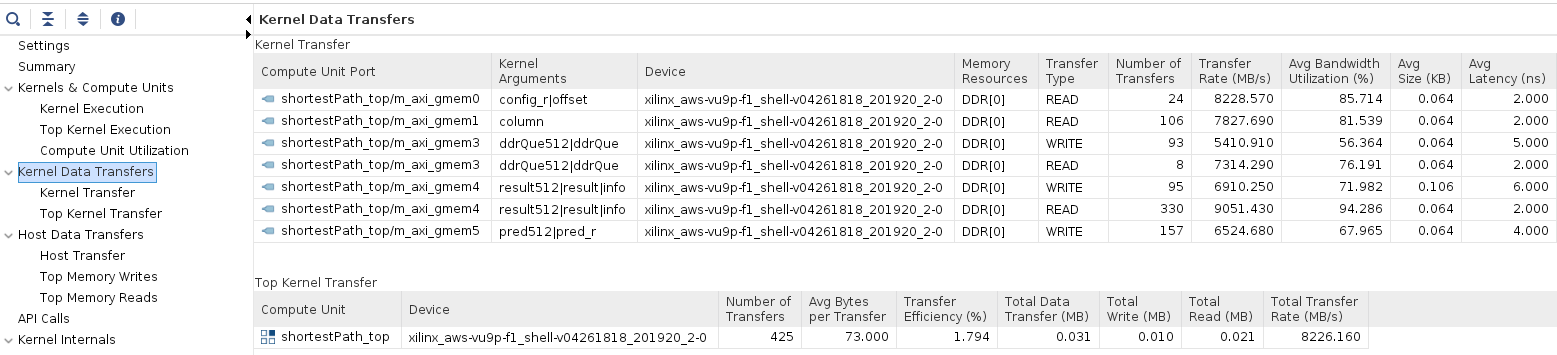
Click Kernel Data Transfer on the right to see read and write buffer sizes, buffer addresses, and the related execution parameters
-
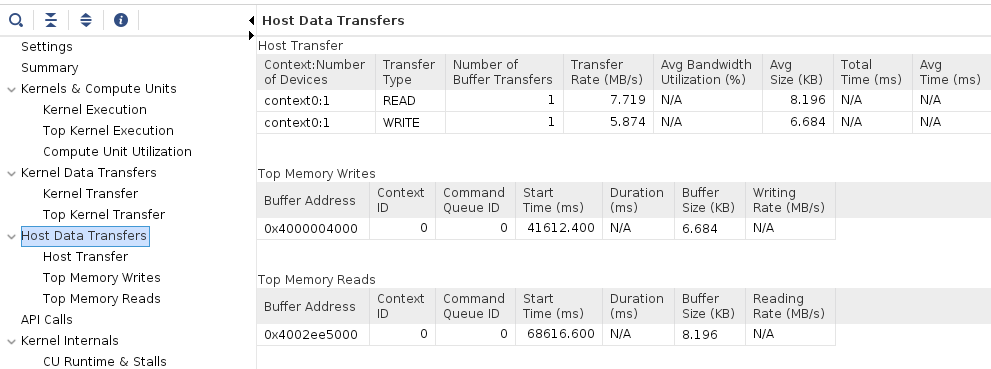
Click Host Data Transfer on the right to see read and write buffer sizes, buffer addresses, and the related execution parameters
-
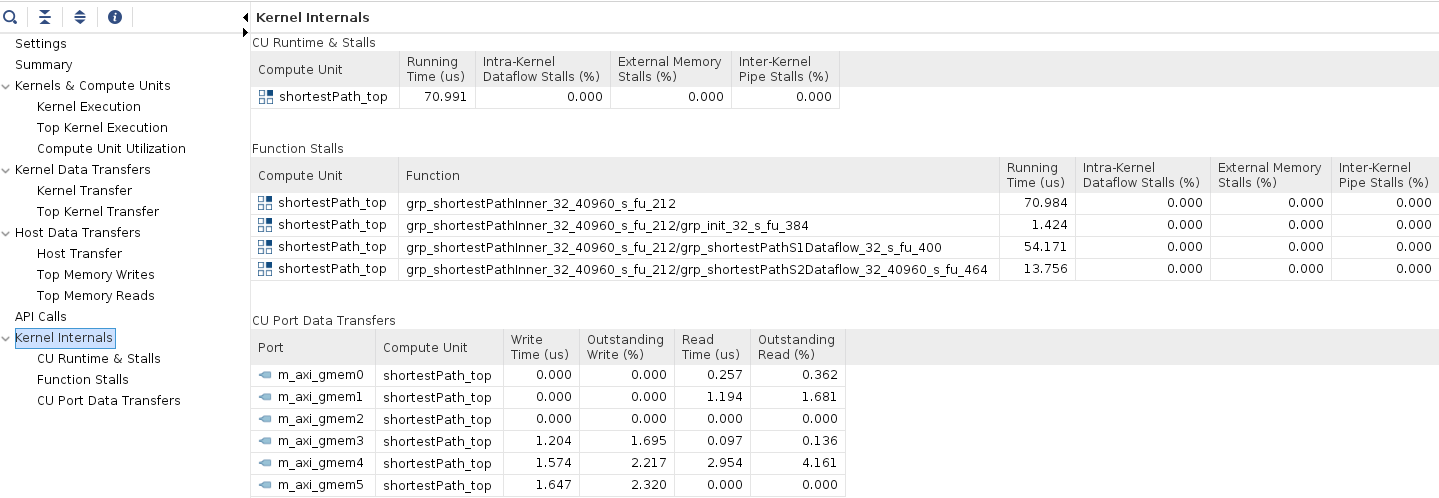
Click Kernel Internals on the right to see read and write buffer sizes, buffer addresses, and the related execution parameters
-
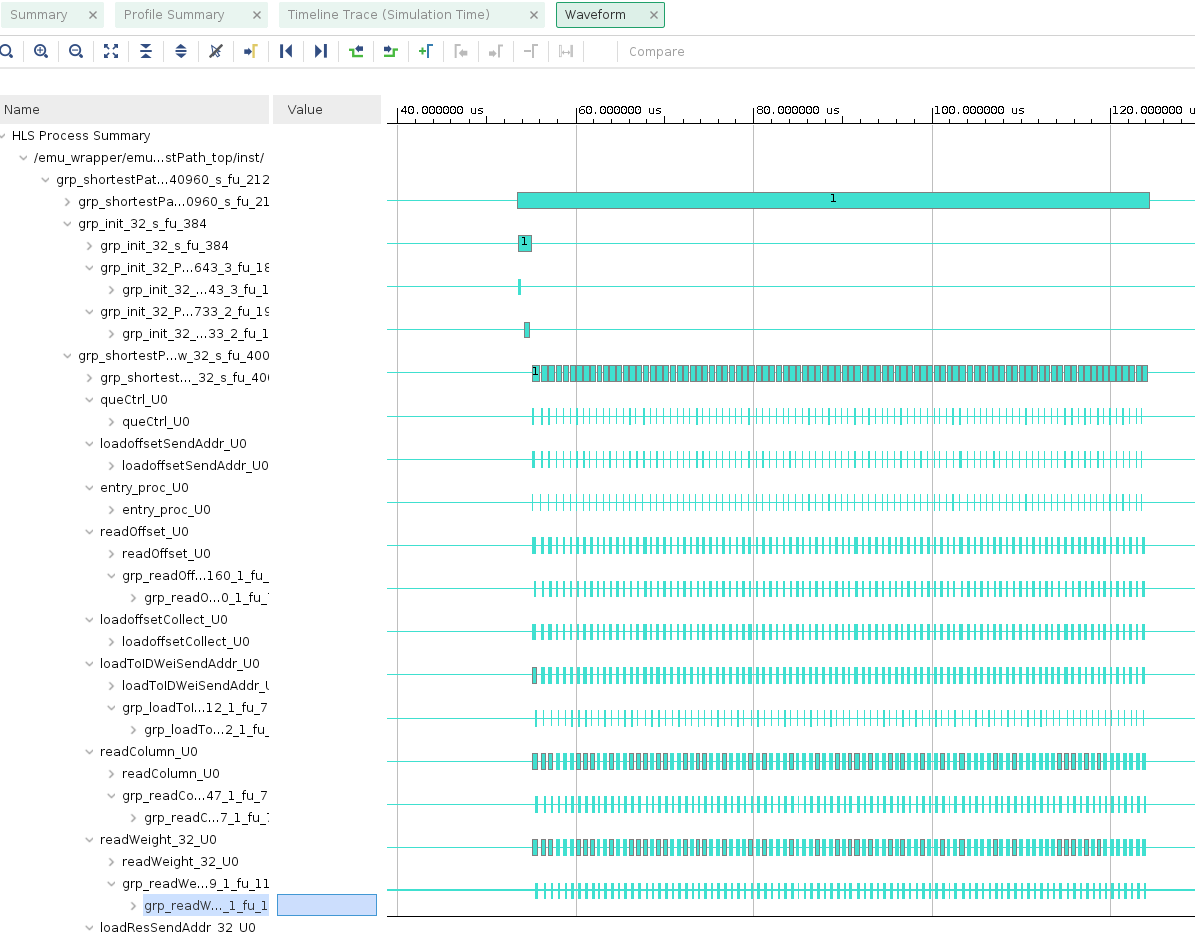
Select the
Waveformpanel on the leftObserve this shows activities similar to what was observed in the Vivado simulator output
-
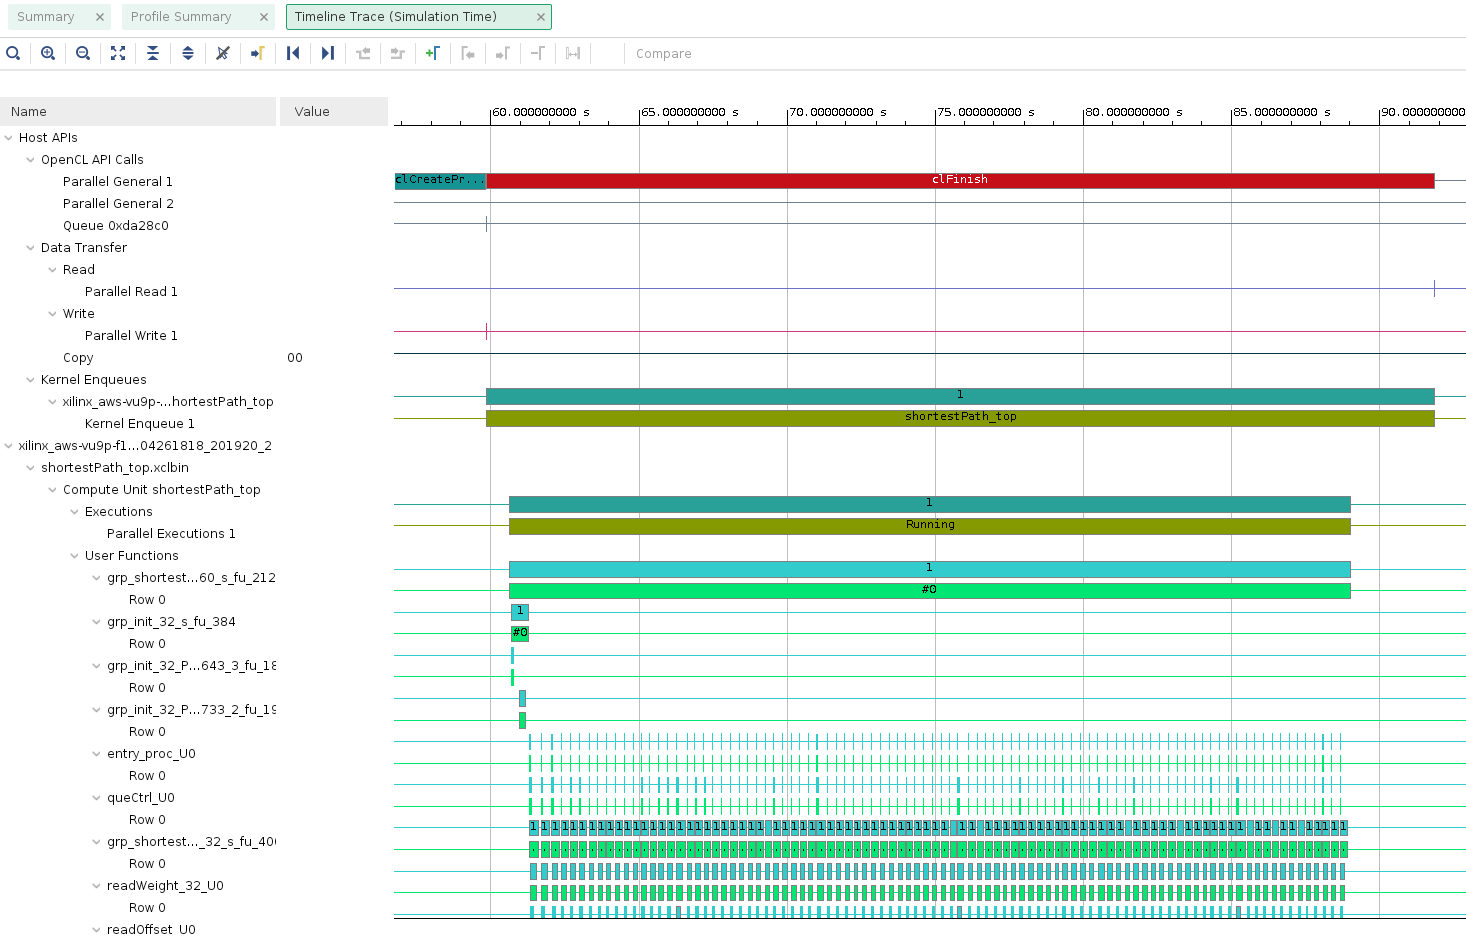
Select the
Timeline Tracepanel on the leftObserve the various events at different time intervals
-
When finished, close the analyzer by clicking
File > Exitand clicking OK
Hardware verification in a non-training session
Note that this step will take about about two hours to generate xclbin and registering it with AWS to generate awsxclbin. You will execute following steps ONLY if you are not in a training session environment
-
Compile kernels, using Makefile, for the hardware verification
make build TARGET=hwThe kernel will be compiled and device binary file (shortestPath_top.xclbin) will be build under the
build_dir.hw.xilinx_aws-vu9p-f1_shell-v04261818_201920_2 -
Once the hardware system is built producing xclbin, you will create an AFI by following the steps listed in create an AFI from the
build_dir.hw.xilinx_aws-vu9p-f1_shell-v04261818_201920_2directory -
After the AFI is available, build the host application by executing from the project directory
make host TARGET=hwThis will create
host.exefile in thebuild_dir.hw.xilinx_aws-vu9p-f1_shell-v04261818_201920_2directory -
Copy the xrt.ini file from the project directory into the
build_dir.hw.xilinx_aws-vu9p-f1_shell-v04261818_201920_2directory -
Run the application by executing the following command from the
build_dir.hw.xilinx_aws-vu9p-f1_shell-v04261818_201920_2directory./host.exe -xclbin ./shortestPath_top.awsxclbin -o ~/Vitis_Libraries/graph/L2/tests/shortest_path_unweighted_pred/data/data-csr-offset.mtx -c ~/Vitis_Libraries/graph/L2/tests/shortest_path_unweighted_pred/data/data-csr-indicesweights.mtx -g ~/Vitis_Libraries/graph/L2/tests/shortest_path_unweighted_pred/data/data-golden.sssp.mtx
Hardware verification in a training session
Since compilation for hardware target will take a long time, the FPGA binary is provided in the solution directory
-
Go to the solution directory
cd ~/xup_compute_acceleration/solutions/graph_lab/The solution directory has the awsxclbin, host.exe, and data directory containing the required files needed by the
host.exeprogram -
Make host.exe executable and run the kernels on hardware
chmod +x host.exe ./host.exe -xclbin ./shortestPath_top.awsxclbin -o ./data/data-csr-offset.mtx -c ./data/data-csr-indicesweights.mtx -g ./data/data-golden.sssp.mtx -
The host application will execute, programming the FPGA and running the host code and displaying result as shown below. Also
xclbin.run_summaryfile will be generated, which can be analyzed using vitis_analyzer---------------------Shortest Path---------------- id: 92 max out: 13 Found Platform Platform Name: Xilinx Info: Context created Info: Command queue created Found Device=xilinx_aws-vu9p-f1_shell-v04261818_201920_2 INFO: Importing ./shortestPath_top.awsxclbin Loading: './shortestPath_top.awsxclbin' Info: Program created Info: Kernel created kernel has been created kernel start------ kernel end------ ============================================================ Info: Test passed
Analyze the run output
-
Start the vitis_analyzer by executing
vitis_analyzer xclbin.run_summaryVitis Analyzer shows Summary, System Diagram, Run Guidance, Profile Summary and Timeline Trace tabs on the left-hand side. Click Profile Summary
-
Click on the
Profile Summaryon the left and then click Kernels & Compute Units on the right to see kernel and compute units execution times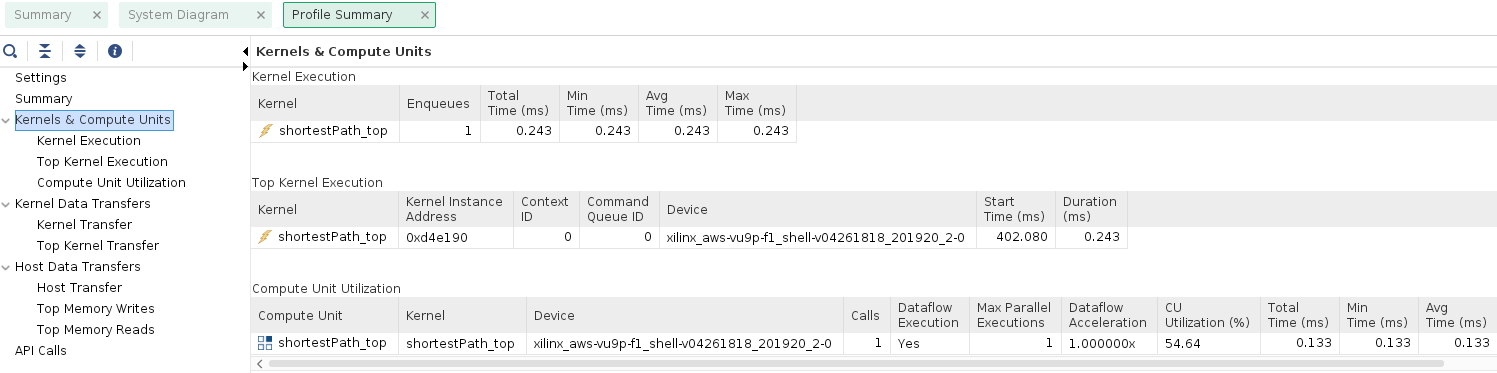
-
Click Kernel Data Transfer on the right to see read and write buffer sizes, buffer addresses, and the related execution parameters
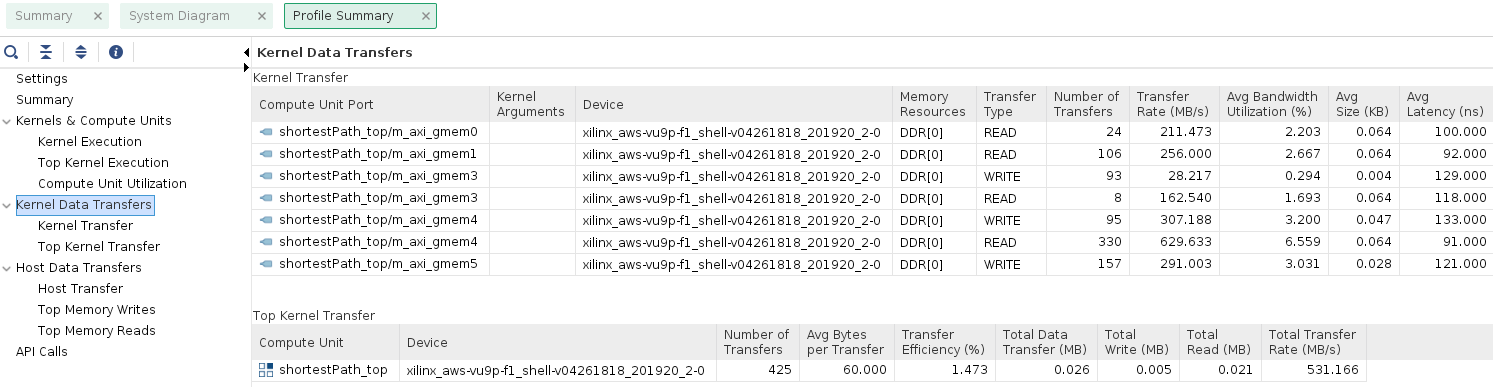
-
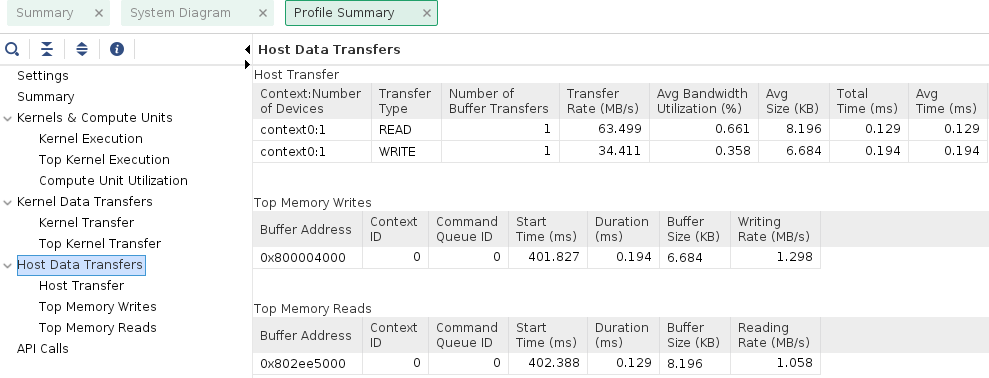
Click Host Data Transfer on the right to see read and write buffer sizes, buffer addresses, and the related execution parameters
-
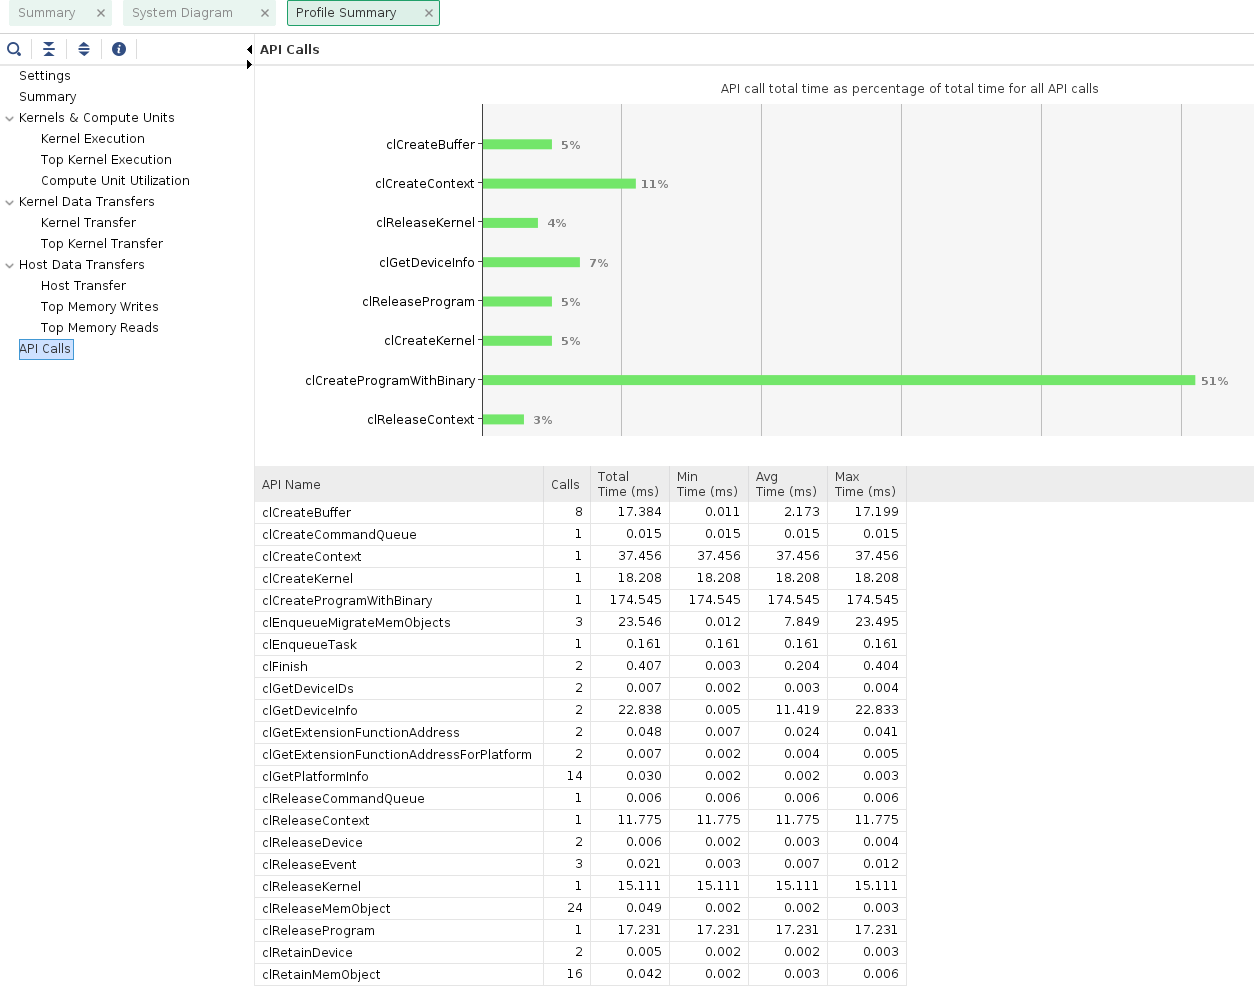
Click API calls on the right to see various API calls and their duration
-
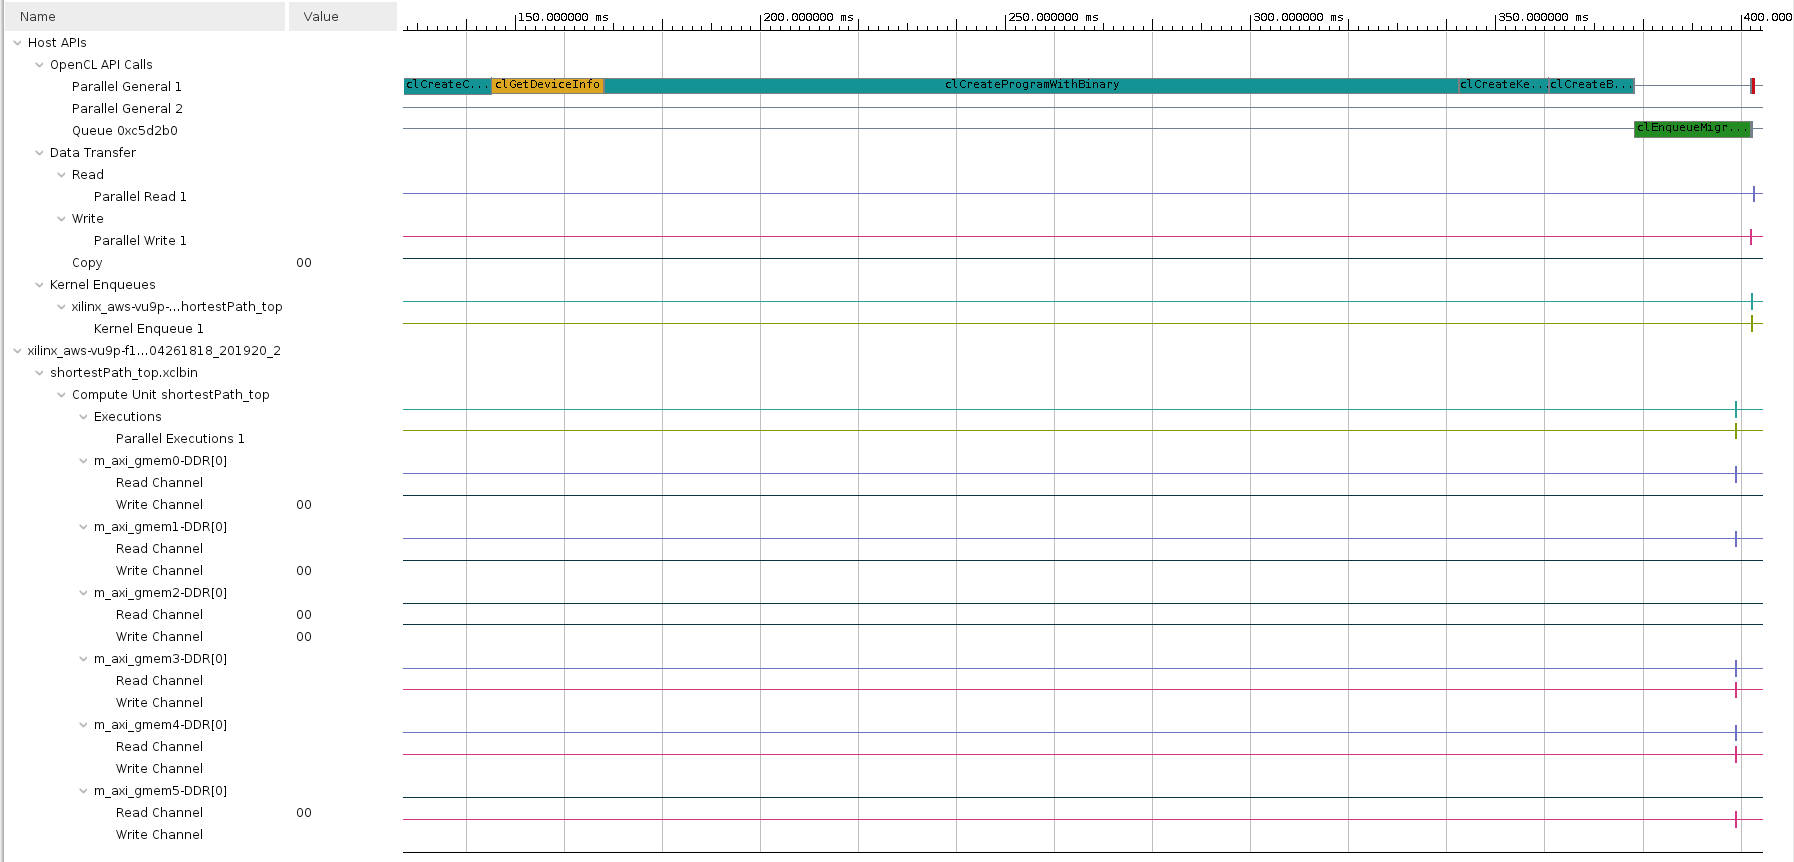
Select the
Timeline Tracepanel on the leftObserve the various events at different time intervals
-
When finished, close the analyzer by clicking
File > Exitand clicking OK
Conclusion
In this lab, you used Makefile provided by the repository from the command line to create an FPGA binary file with one kernel and compile the host application. You performed software and hardware emulations and analyzed the output images. You then run the provided solution in hardware and analyze the output.
Copyright© 2021 Xilinx