Optimization Lab
Introduction
In this lab you will create a Vitis project, analyze the design and optimize the host code and kernel code to improve the system performance.
Objectives
After completing this lab, you will be able to:
- Analyze the design and read project reports
- Optimize the kernel code to improve throughput
- Optimize the host code to improve the data transfer rate
- Verify the functionality of the design in hardware
Create a Vitis Project
-
Start Vitis and select the default workspace (or continue with the workspace from the previous lab)
-
Create a new application project
Use
Create Application Projectfrom Welcome page, or useFile > New > Application Projectto create a new application -
Select your target platform and click Next >
You should see
xilinx_aws-vu9p-f1_shell-v04261818_201920_2as one of the platforms if you are continuing with previous lab, otherwise add it from~/aws-fpga/Vitis/aws_platform -
In the Application Project Details page enter optimization_lab in the Application project name: field and click Next >
-
Select Empty Application template and click Finish
Import the source files into the project
-
In the Explorer view, expand the
optimization_lab_system > optimization_labfolder if necessary, right-click on the src folder, and select Import Sources… -
Browse to the source directory at
~/xup_compute_acceleration/sources/optimization_laband click OK -
Select idct.cpp and click finish
-
Similarly, import krnl_idct.cpp file under
optimization_lab_system > optimization_lab_kernels > src
Add a function as a hardware kernel
-
Double-click on optimization_lab_system > optimization_lab_kernels > optimization_lab_kernels.prj to open the Hardware Kernel Project Settings viewer
-
Click the Add Hardware Function button icon (
 ) in the Hardware Functions window to see functions available for implementation in hardware
 -
Select krnl_idct function and click OK
-
Notice the krnl_idct function is added
Analyze the source files
-
From the Explorer view, open the optimization_lab_system > optimization_lab_kernels > src > krnl_idct.cpp file
-
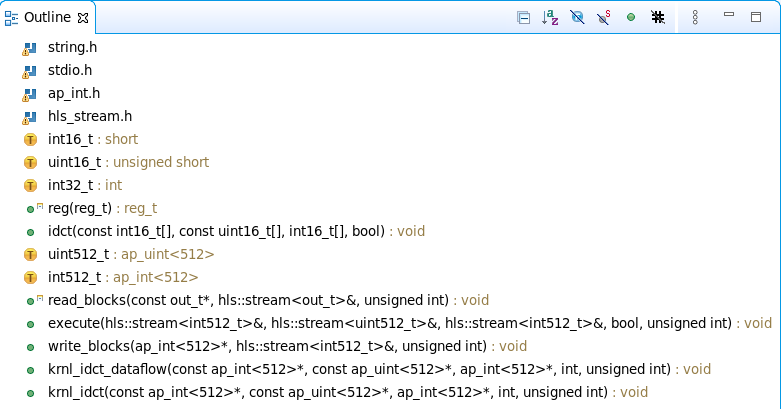
The Outline panel should be visible. It displays an outline of the code of the source file that is currently in scope. If you cannot see it, go to Window > Show View… then select General > Outline
The outline view can be used to navigate the source file. For example, function names are displayed in the outline view, and clicking on a function will jump to the line of code where the function is defined
-
In the Outline viewer, click on idct to look up the function
The
idct()function is the core algorithm in the kernel. It is a computationally intensive function that can be highly parallelized on the FPGA, providing significant acceleration over a CPU-based implementation -
Review the code
- krnl_idct : Top-level function for the hardware kernel. Interface properties for the kernel are specified in this function
- krnl_idct_dataflow : Called by the krnl_idct function and encapsulates the main functions of the kernel
- read_blocks : Reads data from global memory data sent by the host application and streams to the execute function
- execute : For each 8x8 block received, calls the idct function to perform the actual IDCT computation
- write_blocks : Receives results from the execute function and writes them back to global memory for the host application
- Open the idct.cpp file. Again, use the Outline viewer to quickly look up and inspect the important functions of the host application:
- main : Initializes the test vectors, sets-up OpenCL resources, runs the reference model, runs the hardware kernel, releases the OpenCL resources, and compares the results of the reference IDCT model with the hardware implementation
- runFPGA : Takes in a vector of inputs and for each 8x8 block calls the hardware accelerated IDCT using the write, run, read and finish helper functions. These function use OpenCL API calls to communicate with the FPGA
- runCPU : Takes in a vector of inputs and, for each 8x8 block, calls idctSoft , a reference implementation of the IDCT
- idctSoft : Software implementation of the IDCT algorithm, used to check the results from the FPGA
- oclDct : This class is used to encapsulate the OpenCL runtime calls to interact with the kernel in the FPGA
- aligned_allocator , smalloc , load_file_to_memory : These are small helper functions used during test vector generation and OpenCL setup
-
Look at the code around line number 497 of the idct.cpp file. Press Ctrl+l (lower case L) and enter 497 to jump to this line This section of code is where the OpenCL environment is setup in the host application. This is typical of most Vitis applications, and will look very familiar to developers with prior OpenCL experience. This body of code can often be reused as-is from project to project
To setup the OpenCL environment, the following API calls are made:
- clGetPlatformIDs : This function queries the system to identify any available OpenCL platforms. It is called twice as it first extracts the number of platforms before extracting the actual supported platforms
- clGetPlatformInfo : Gets specific information about the OpenCL platform, such as vendor name and platform name
- clGetDeviceIDs : Obtains list of devices available on a platform
- clCreateContext : Creates an OpenCL context, which manages the runtime objects
- clGetDeviceInfo : Gets information about an OpenCL device like the device name
- clCreateProgramWithBinary : Creates a program object for a context, and loads specified binary data into the program object. The actual program is obtained before this call through
load_file_to_memory()function - clCreateKernel : Creates a kernel object
- clCreateCommandQueue : Creates a command-queue on a specific device
Note: all objects are accessed through a clCreate… function call, and they should be released before terminating the program by calling a corresponding clRelease… This avoids memory leakage and clears locks on the device.
Perform HW Emulation
- Make sure you change the target by clicking on the drop-down button of Active build configuration and select Emulation-HW
Configure the System Port in the Vitis GUI
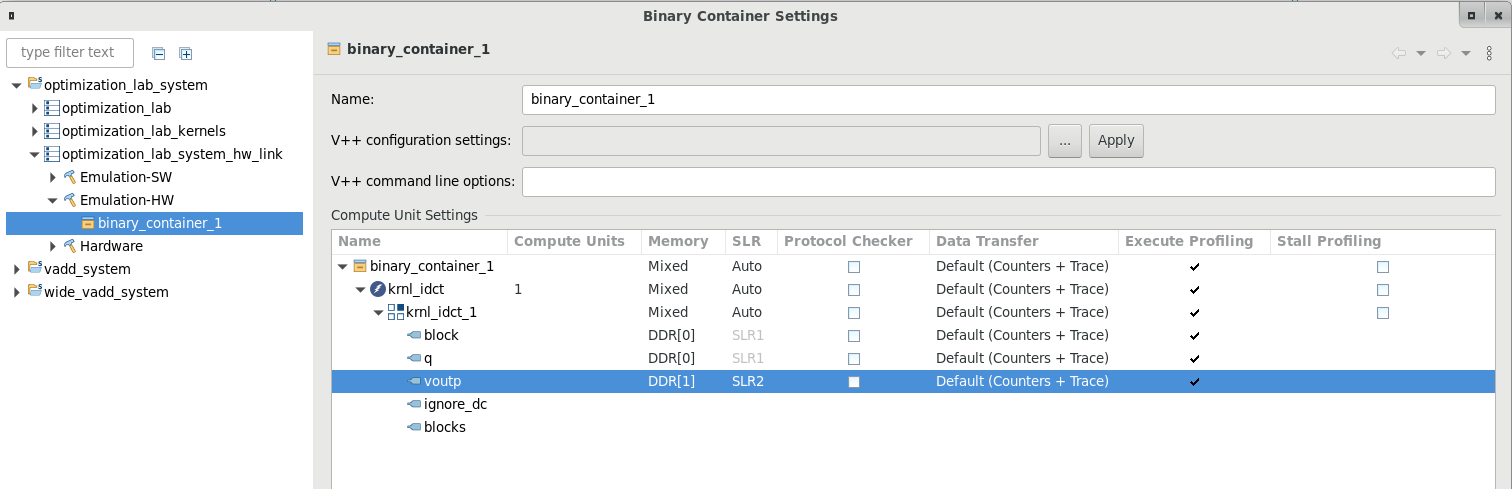
In the idct.cpp file, locate lines 286-297. Note that two memory buffers, mInBuffer and mOutBuffer are being used. The memory buffers will be located in external DRAM. The kernel will have one or more ports connected to the memory bank(s). By default, the compiler will connect all ports to DDR[0].
-
In the Assistant view, right click on optimization_lab_system > optimization_lab_system_hw_link > Emulation-HW > binary_container_1 and click Settings…
-
Under Compute Unit Settings expand krnl_idct and krnl_idct_1
-
Configure the kernel as shown in the image below
-
Click Apply and Close
Run Hardware Emulation
-
Select optimization_lab_system in the Assistant view and build the project (
 )
)Wait for the build to complete which will generate
binary_container_1.xclbinfile in the Emulation-HW directory -
Select Run > Run Configurations… to open the configurations window
-
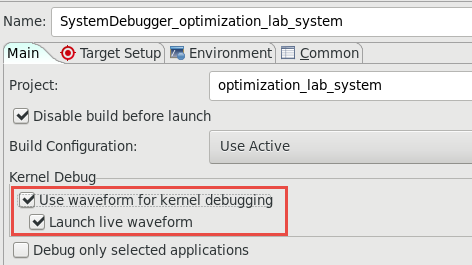
Double-click on the System Project Debug to create new configuration
-
In the Main tab, click to select Use waveform for kernel debugging and Launch live waveform
-
Click Apply and then Run to run the application
The Console tab shows that the test was completed successfully along with the data transfer rate
FPGA number of 64*int16_t blocks per transfer: 256
DEVICE: xilinx_aws-vu9p-f1_shell-v04261818_201920_2
Loading Bitstream: ../binary_container_1.xclbin
INFO: Loaded file
INFO: [HW-EM 01] Hardware emulation runs simulation underneath....
Create Kernel: krnl_idct
Create Compute Unit
Setup complete
Running CPU version
Running FPGA version
INFO::[ Vitis-EM 22 ] [Time elapsed: 0 minute(s) 51 seconds, Emulation time: 0.171543 ms]
Data transfer between kernel(s) and global memory(s)
krnl_idct_1:m_axi_gmem0-DDR[0]          RD = 128.000 KB             WR = 0.000 KB
krnl_idct_1:m_axi_gmem1-DDR[0]          RD = 0.500 KB               WR = 0.000 KB
krnl_idct_1:m_axi_gmem2-DDR[1]          RD = 0.000 KB               WR = 128.000 KB

INFO: [HW-EM 06-0] Waiting for the simulator process to exit
INFO: [HW-EM 06-1] All the simulator processes exited successfully
Runs complete validating results
TEST PASSED
RUN COMPLETE
Notice that Vivado was started and the simulation waveform window is updated. It will run for about 165 us
-
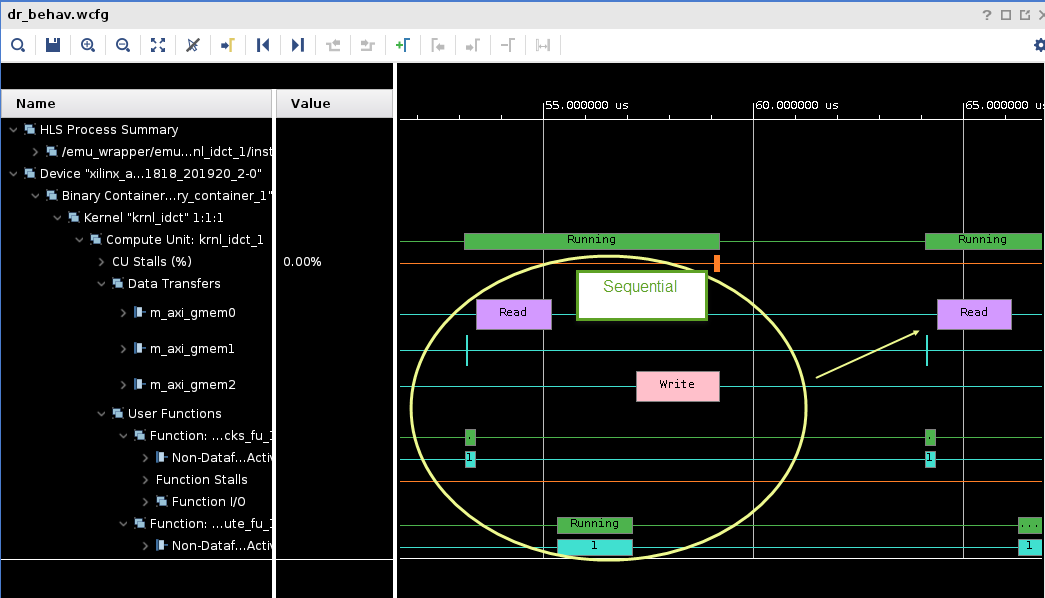
Click on the Zoom Fit (
 ) button and scroll down the waveform window to see activities taking place in the kernel
Notice the gaps between write and the next read and execution of the kernel.
-
Close Vivado when you are ready by selecting File > Exit and clicking OK. We will not examine the transactions in detail.
Understand the HLS Report, profile summary, and Application Timeline
-
In the Assistant view, expand optimization_lab_system > optimization_lab > Emulation-HW > SystemDebugger_optimization_lab_system_optimization_lab and double-click on Run Summary (xclbin)
-
Vitis Analyzer window will open showing binary_container_1.xclbin (Hardware Emulation)
-
Click on Profile Summary report and review it
-
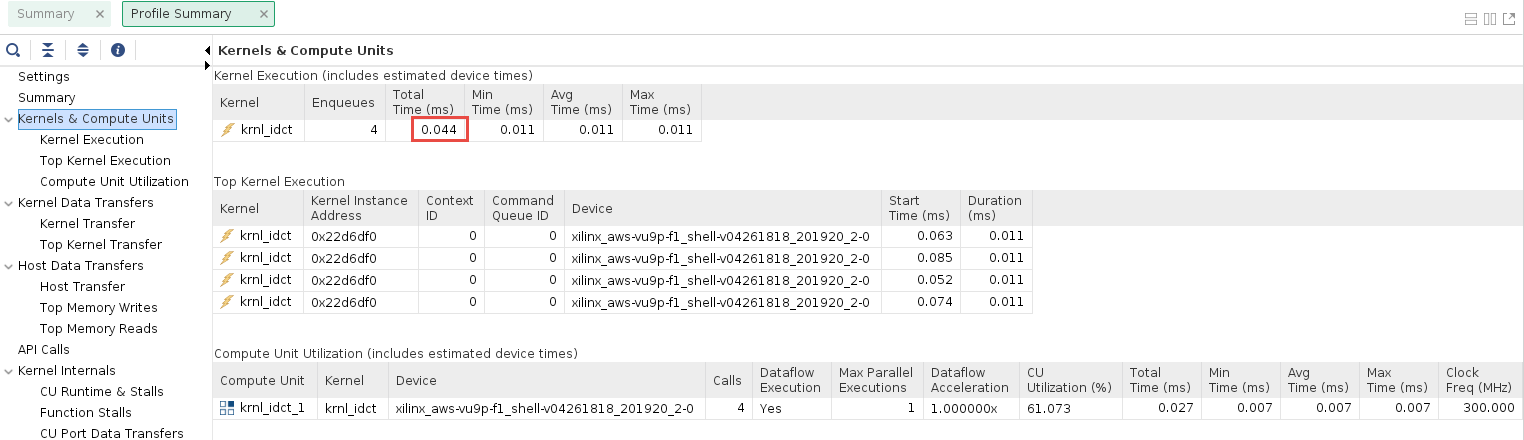
Click on the Kernels & Compute Units tab in the Profile Summary report
-
Review the Kernel Total Time (ms)
This number will serve as a baseline (reference point) to compare against after optimization. This baseline may be different depending on the target platform
-
Exit out of Vitis Analyzer. In the Assistant view, expand optimization_lab_system > optimization_lab_system_hw_link > Emulation-HW > binary_container_1 and double-click on Link Summary (binary_container_1)
-
Vitis Analyzer window will update and now it also includes krnl_idct (Hardware Emulation)
-
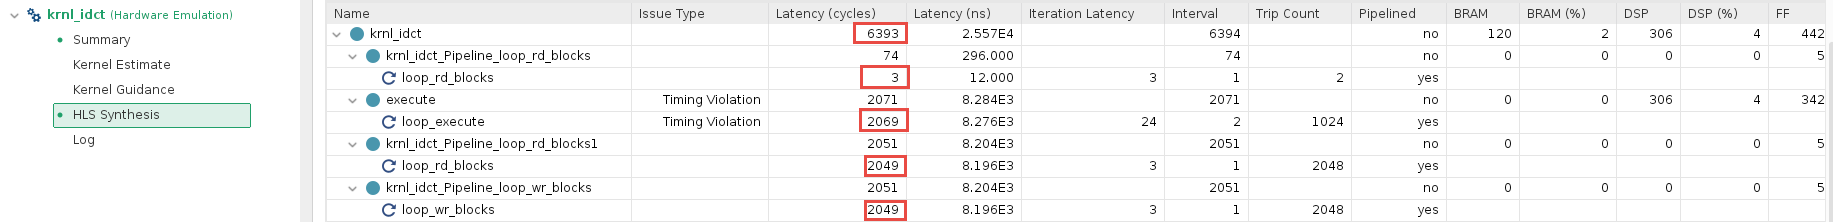
Click on HLS Synthesis and review it
-
The
krnl_idcthas a latency of ~6,400 (cycles)The numbers may vary slightly depending on the target hardware you selected. The numbers will serve as a baseline for comparison against optimized versions of the kernel
-
The report also shows the three main functions that are part of the
krnl_idctkernel- Note that these 4 sub-functions, three of which execute, loop_rd_blocks and loop_wr_blocks have roughly the same latency and that their sum total is equivalent to the total Interval reported in the Summary table
- This indicates that the three sub-functions are executing sequentially, hinting at an optimization opportunity
-
Close all the reports by selecting File > Exit
Analyze the kernel code and apply the DATAFLOW directive
-
Open the optimization_lab_system > optimization_lab_kernels > src > krnl_idct.cpp file in the Explorer view
-
Using the Outline viewer, navigate to the krnl_idct_dataflow function
Observe that the three functions are communicating using hls::streams objects. These objects model a FIFO-based communication scheme. This is the recommended coding style which should be used whenever possible to exhibit streaming behavior and allow DATAFLOW optimization
-
Enable the DATAFLOW optimization by uncommenting the #pragma HLS DATAFLOW present in the krnl_idct_dataflow function (line 319)
The DATAFLOW optimization allows each of the subsequent functions to execute as independent processes. This results in overlapping and pipelined execution of the read, execute and write functions instead of sequential execution. The FIFO channels between the different processes do not need to buffer the complete dataset anymore but can directly stream the data to the next block.
-
Save the file
Build the project in Hardware Emulation configuration and analyze the HLS report
-
Make sure the active configuration is Emulation-HW
-
Select the optimization_lab_system in the Explorer view and click on the Build button (
) to build the project -
In the Assistant view, expand optimization_lab_system > optimization_lab_kernels > Emulation-HW > krnl_dict and double-click on Compile Summary (krnl_idct)
-
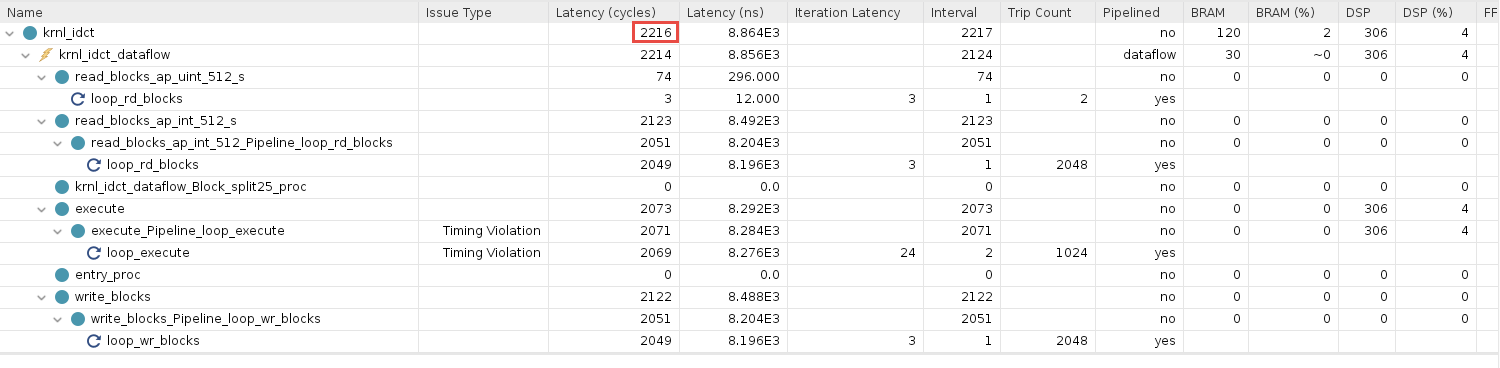
Click on HLS Synthesis and review it
Note that that latency now is ~2,000 (cycles)
Run the Hardware Emulation
-
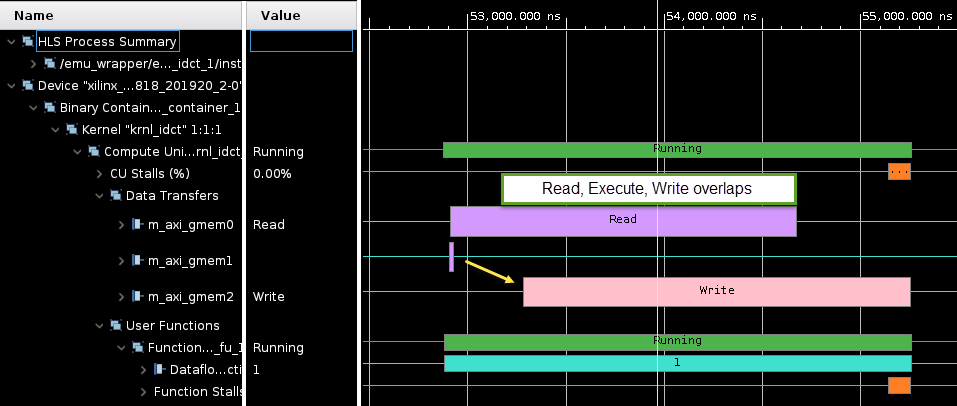
Run the hardware emulation. Wait for the run to finish with
RUN COMPLETEmessageNotice the effect of the dataflow optimization in the Vivado simulation waveform view. The read, write and kernel execution overlap and are much closer together.
-
Close Vivado
-
In the Assistant view, expand optimization_lab_system > optimization_lab > Emulation-HW > SystemDebugger_optimization_lab_system_optimization_lab and double-click the Run Summary (xclbin)
-
Click on Profile Summary
-
Select the Kernels & Compute Units tab
Compare the Total Time (ms) with the results from the un-optimized run (numbers may vary slightly to the results displayed below)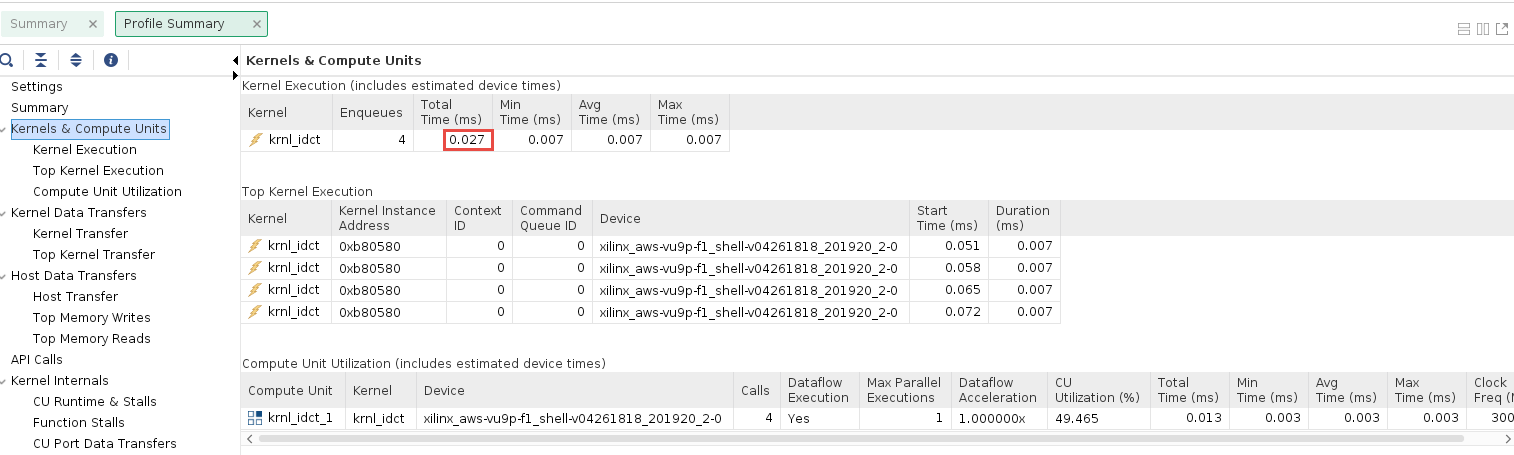
Analyze the host code
-
Open the optimization_lab_system > optimization_lab > src > idct.cpp file from the Explorer view
-
Using the Outline viewer, navigate to the runFPGA function
For each block of 8x8 values, the runFPGA function writes data to the FPGA, runs the kernel, and reads results back. Communication with the FPGA is handled by the OpenCL API calls made within the
cu.write(),cu.run()andcu.read()function callsclEnqueueMigrateMemObjects()schedules the transfer of data to or from the FPGAclEnqueueTask()schedules the executing of the kernel
These OpenCL functions use events to signal their completion and synchronize execution
-
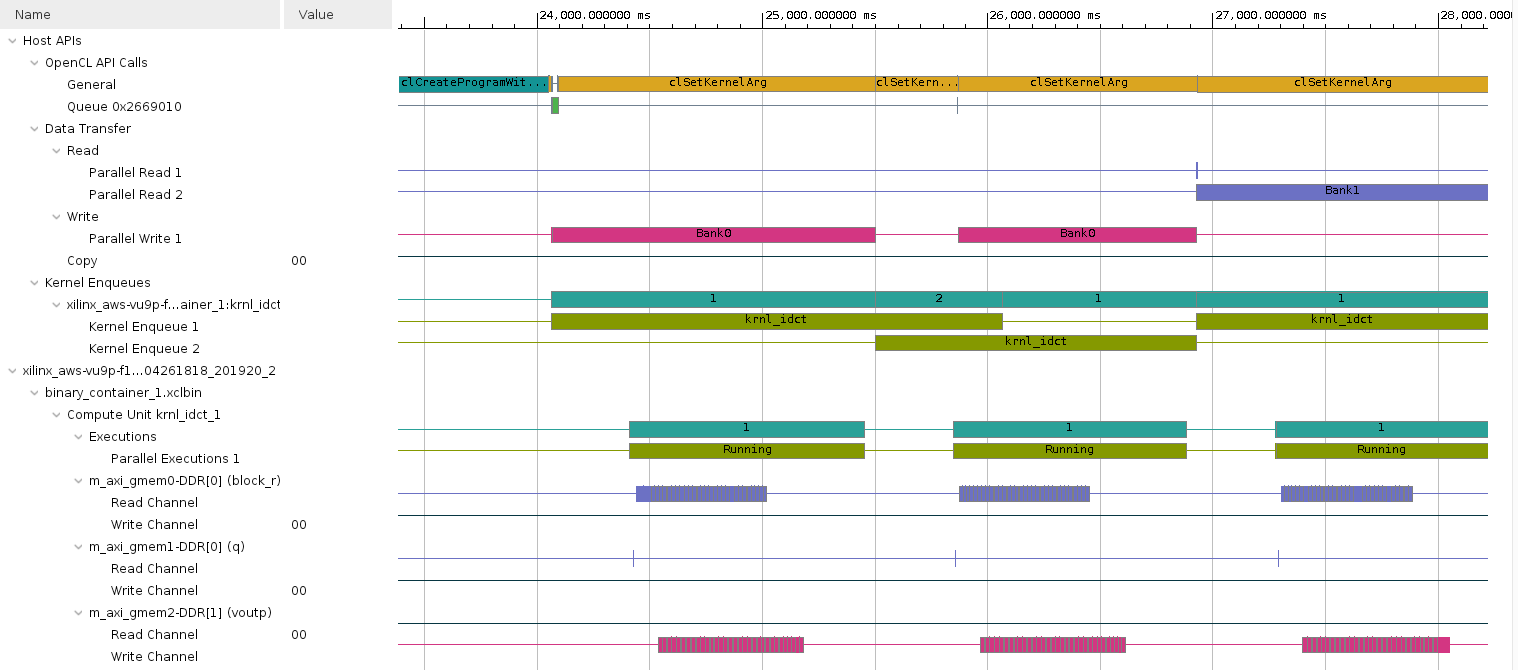
Open the Timeline Trace of the Emulation-HW run in Vitis Analyzer
The green segments indicate when the IDCT kernel is running
Notice that there are gaps between each of the green segments indicating that the operations are not overlapping
-
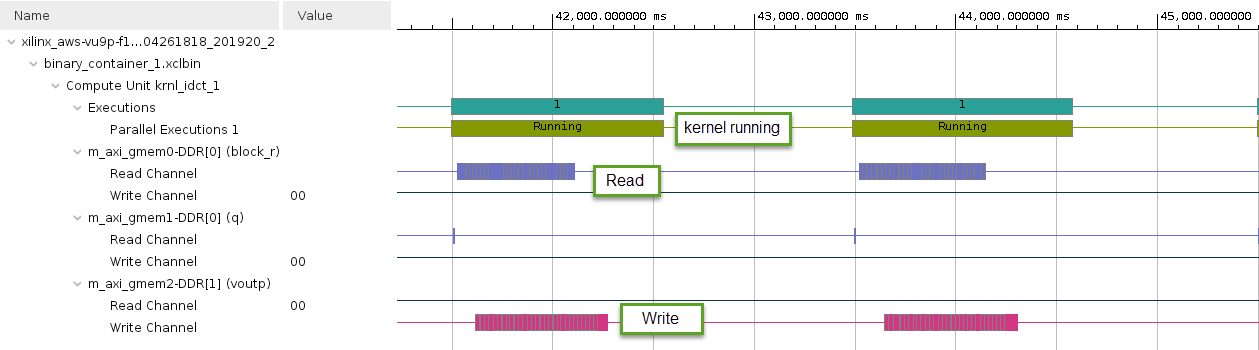
Zoom in by performing a left mouse drag across one of these gaps to get a more detailed view
- The two green segments correspond to two consecutive invocations of the IDCT kernel
- The gap between the two segments is indicative of the kernel idle time between these two invocations
- The Data Transfer section of the timeline shows that Read and Write operations are happening when the kernel is idle
- The Read operation is to retrieve the results from the execution which just finished, and the Write operation is to send inputs for the next execution
- The gap in time between kernel invocations reduces the utilization of the hardware kernel, and the performance of the system
-
Close Vitis Analyzer
-
In the idct.cpp file, go to the
oclDct::write()function (line ~260)Notice on line ~274, the function synchronizes on the outEvVec event through a call to
clWaitForEvents()clWaitForEvents(1, &outEvVec[mCount]);- This event is generated by the completion of the
clEnqueueMigrateMemObjects()call in theoclDct::read()function (line ~346) - Effectively the next execution of the
oclDct::write()function is gated by the completion of the previousoclDct::read()function, resulting in the sequential behavior observed in the Application Timeline
- This event is generated by the completion of the
- Use the Outline viewer to locate the definition of the NUM_SCHED macro in the idct.cpp file
- This macro defines the depth of the event queue
- The value of 1 explains the observed behavior: new tasks (write, run, read) are only enqueued when the previous has completed effectively synchronizing each loop iteration
- By increasing the value of the NUM_SCHED macro, we increase the depth of the event queue and enable more blocks to be enqueued for processing, which should result in the write, run and read tasks overlapping, allowing the kernel to execute continuously or at least reducing the delay between invocations
-
Modify line 152 to increase the value of NUM_SCHED to 6 as follows
#define NUM_SCHED 6 - Save the file
Run Hardware Emulation
-
Build the application by clicking on the (
) buttonSince only the idct.cpp file was changed, only the host code is rebuilt. This should be much faster as no recompiling of the hardware kernel is required.
-
Change the run configuration by unchecking the Use waveform for kernel debugging option, and enable host tracing by clicking on the Edit…* button of the Xilinx Runtime Profiling and clicking **OpenCL trace check box for the Host Trace, click Apply, and then click Run
-
In the Assistant view, expand optimization_lab_system > optimization_lab > Emulation-HW > SystemDebugger_optimization_lab_system_optimization_lab and double-click the Run Summary (xclbin)
-
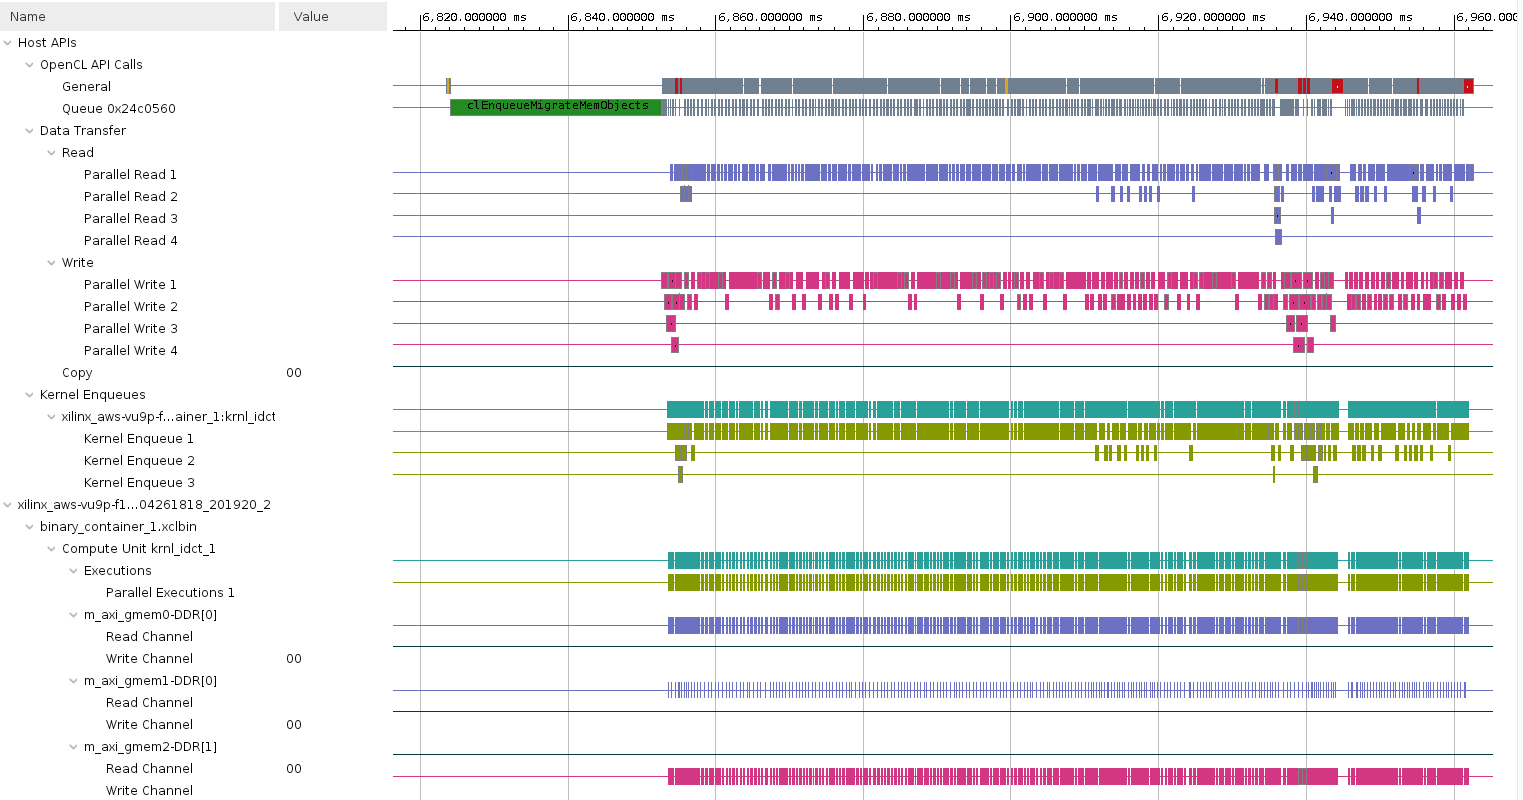
On Vitis Analyzer window click on Timeline Trace
Observe how software pipelining enables overlapping of data transfers and kernel execution.
Note: system tasks might slow down communication between the application and the hardware simulation, impacting on the performance results. The effect of software pipelining is considerably higher when running on the actual hardware.
Build system hardware with profiling and timing analysis options if are continuing with the lab OTHERWISE skip to Prebuilt
-
Set
Active build configuration:toHardwareon the upper right corner of Application Project Settings viewIn order to collect the profiling data and run Timing Analyzer on the application run in hardware, we need to setup some options.
-
Select
optimization_lab_system > optimization_lab_system_hw_link > Hardware > binary_container_1in Assistant view and then click on Settings. Click on the Data Transfer drop-down button in binary_container_1 row and select Counters+Trace option. This should also enable Execute Profiling option. If not, then click on the corresponding check box. -
In the V++ command line options: field, enter
--profile.data allto enable kernel profiling -
Select Trace Memory to be FIFO type and size of 64K. This is the memory where traces will be stored. You also have the option to store this information in DDR (max limit 4 GB) and PLRAM
-
Click Apply and Close
-
Build the project by selecting optimization_lab_system in
Assistantview and clicking the build buttonNormally, you would build the hardware, but since it can take approximately two hours you should NOT BUILD it now. Instead you can use the precompiled solution.
-
A
binary_container_1.xclbinandoptimization_labapplication will be generated in theoptimization_lab/Hardwaredirectory -
Register the generated xclbin file to generate binary_container_1.awsxclbin by running the shell script. Follow instructions available here
Run the system in hardware
-
If you have built the hardware yourself then copy the necessary files using the following commands:
cp binary_container_1.awsxclbin ~/workspace/optimization_lab/Hardware cp ~/xup_compute_acceleration/sources/xrt.ini ~/workspace/optimization_lab/Hardware/. -
If you have not built the hardware yourself then copy the provided prebuilt solution files using the following commands:
mkdir -p ~/workspace/optimization_lab/Hardware && mkdir -p ~/workspace/optimization_lab_system/Hardware
cp ~/xup_compute_acceleration/solutions/optimization_lab/* ~/workspace/optimization_lab/Hardware/
cp ~/xup_compute_acceleration/solutions/optimization_lab/binary_container_1.awsxclbin ~/workspace/optimization_lab_system/Hardware/binary_container_1.xclbin
chmod +x ~/workspace/optimization_lab/Hardware/optimization_lab
Setup the run configuration so you can run the application and then analyze results from GUI
-
Right-click on
optimization_lab_systemin Assistant view, selectRun > Run Configurations... -
Click on the Edit… button of the Program Arguments, uncheck Automatically add binary container(s) to arguments, then enter ../binary_container_1.awsxclbin after clicking in the Program Arguments field. Finally, click OK
-
click on the
Edit...button of the Xilinx Runtime Profiling section, select the OpenCL trace option and click OK -
Execute the application by clicking Apply and then Run. The FPGA bitstream will be downloaded and the host application will be executed showing output similar to:
FPGA number of 64*int16_t blocks per transfer: 16384 DEVICE: xilinx_aws-vu9p-f1_dynamic_5_0 Loading Bitstream: ../binary_container_1.awsxclbin INFO: Loaded file Create Kernel: krnl_idct Create Compute Unit Setup complete Running CPU version Running FPGA version Runs complete validating results TEST PASSED CPU Time: 0.764289 s CPU Throughput: 669.904 MB/s FPGA Time: 0.116871 s FPGA Throughput: 4380.91 MB/s FPGA PCIe Throughput: 8761.82 MB/s -
In the Assistant view, double click
optimization_lab_system > optimization_lab > Hardware > SystemDebugger_optimization_lab_system_optimization_lab > Run Summary (xclbin)to open Vitis AnalyzerClick Timeline Trace. Zoom in at the end of the timeline and observe the activities in various parts of the system.
-
Click on the Profile Summary entry in the left panel, and observe multi-tab (four tabs) output
- Kernels & Compute Units
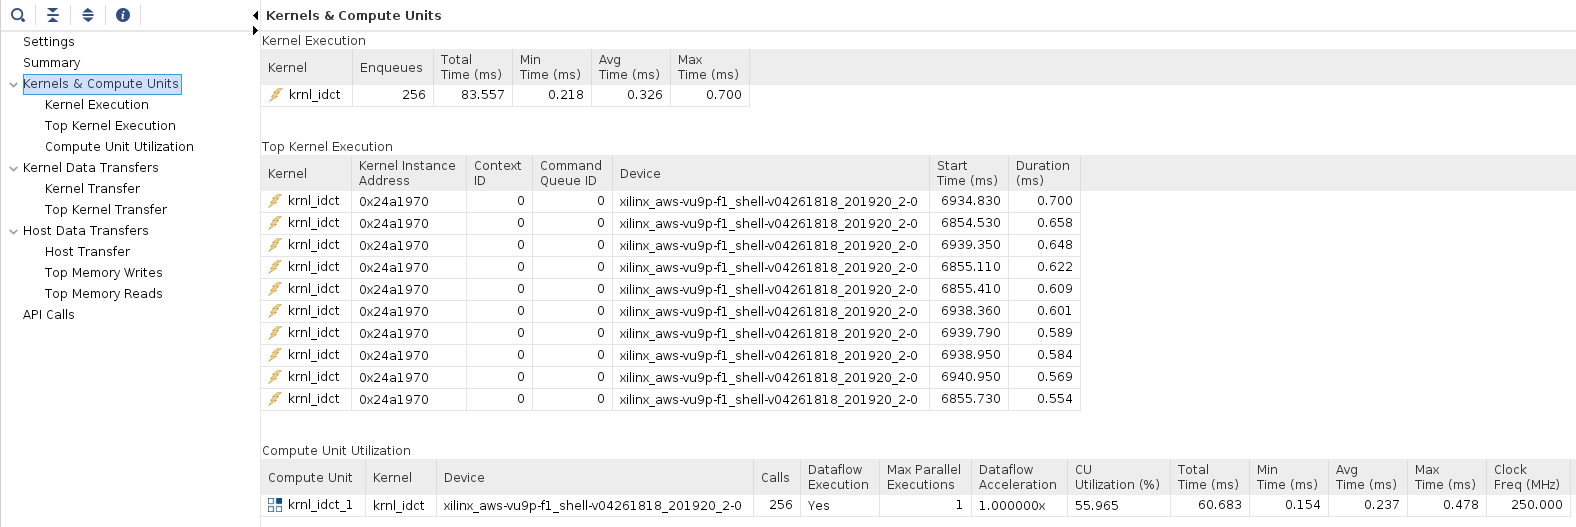
- Kernel Data Transfers
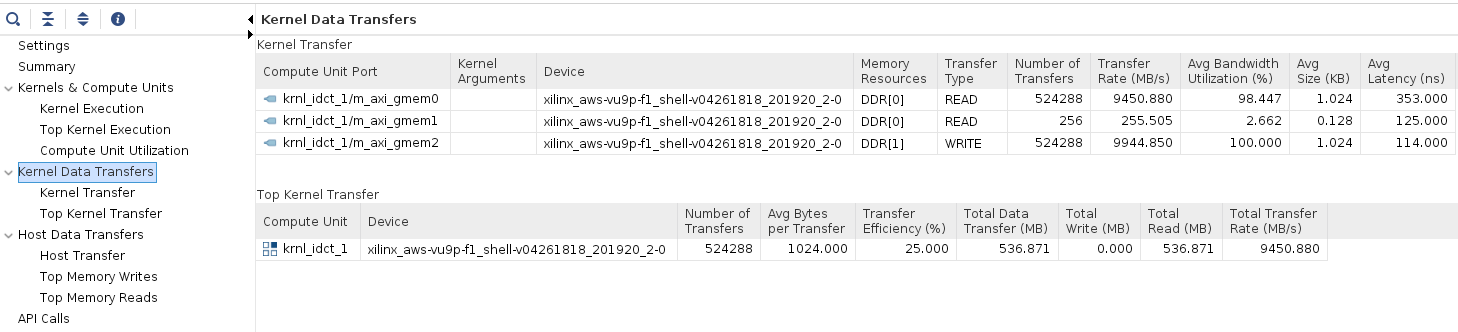
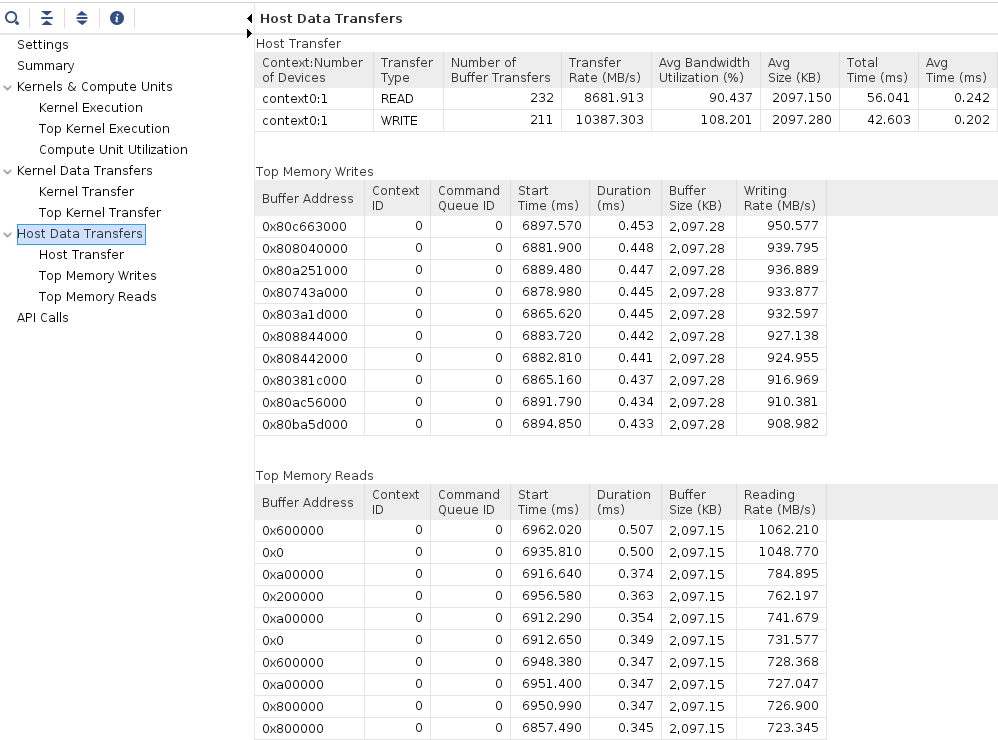
- Host Data Transfer
-
When finished, close the analyzer by clicking
File > Exitand clicking OK
Conclusion
In this lab, you used Vitis to create a project and add a kernel (hardware) function. You performed software and hardware emulation, analyzed the design and the various reports generated by the tools. You then optimized the kernel code using the DATAFLOW pragma, and host code by increasing the number of read, write, and run tasks to improve throughput and data transfer rates. You then validated the functionality in hardware.
Note if you disable the profiling you can get an acceleration of ~6.2x.
Appendix Build Full Hardware
Set the build configuration to Hardware and build the system (Note that since the building of the project takes over two hours skip this step in the workshop environment).
-
Click on the drop-down button of Active build configuration: and select Hardware
-
Set the Vitis Kernel Linker flag as before but for Hardware
-
Either select Project > Build Project or click on the (
) button.
This will build the project under the Hardware directory. The built project will include optimization_lab file along with binary_container_1.xclbin file. This step takes about two hours
AWS-F1
Once the full system is built, you should create an AWS F1 AFI to run this example in AWS-F1.
Copyright© 2021 Xilinx