Internal Design of Triangle Counting
Overview
Triangle counting is a community detection graph algorithm that is used to determine the number of triangles passing through each node in the graph. A triangle is a set of three nodes, where each node has a relationship to all other nodes.
Algorithm
The algorithm of Triangle Count is as follows:
- Calculate the neighboring nodes of each node.
- Calculate the intersection for each edge and find the node whose id in the intersection is greater than the id of the first two nodes.
- For each node, count the total number of Triangles. Note that only the Triangle Counts that meet the calculation direction are counted.
Note: When calculating triangles, there must be a calculation direction (for example, starting node id <intermediate node id <destination node id).
Assume that node A and node B are neighbors. The set of neighbors of node A is {B, C, D, E}, the set of neighbors of node B is {A, C, E, F, G}, and their intersection is {C, E} . The nodes in the intersection are the common neighbors of node A and node B, so there are two triangles {A, B, C} and {A, B, E}.
Implemention
The input matrix should ensure that the following conditions hold:
- Undirected graph.
- No self edges.
- All edges are oriented (src ID is greater than dst ID for compressed sparse column (CSC) format or dst ID is greater than src ID for compressed sparse row (CSR) format).
- No duplicate edges.
The algorithm implemention is shown as the figure below:
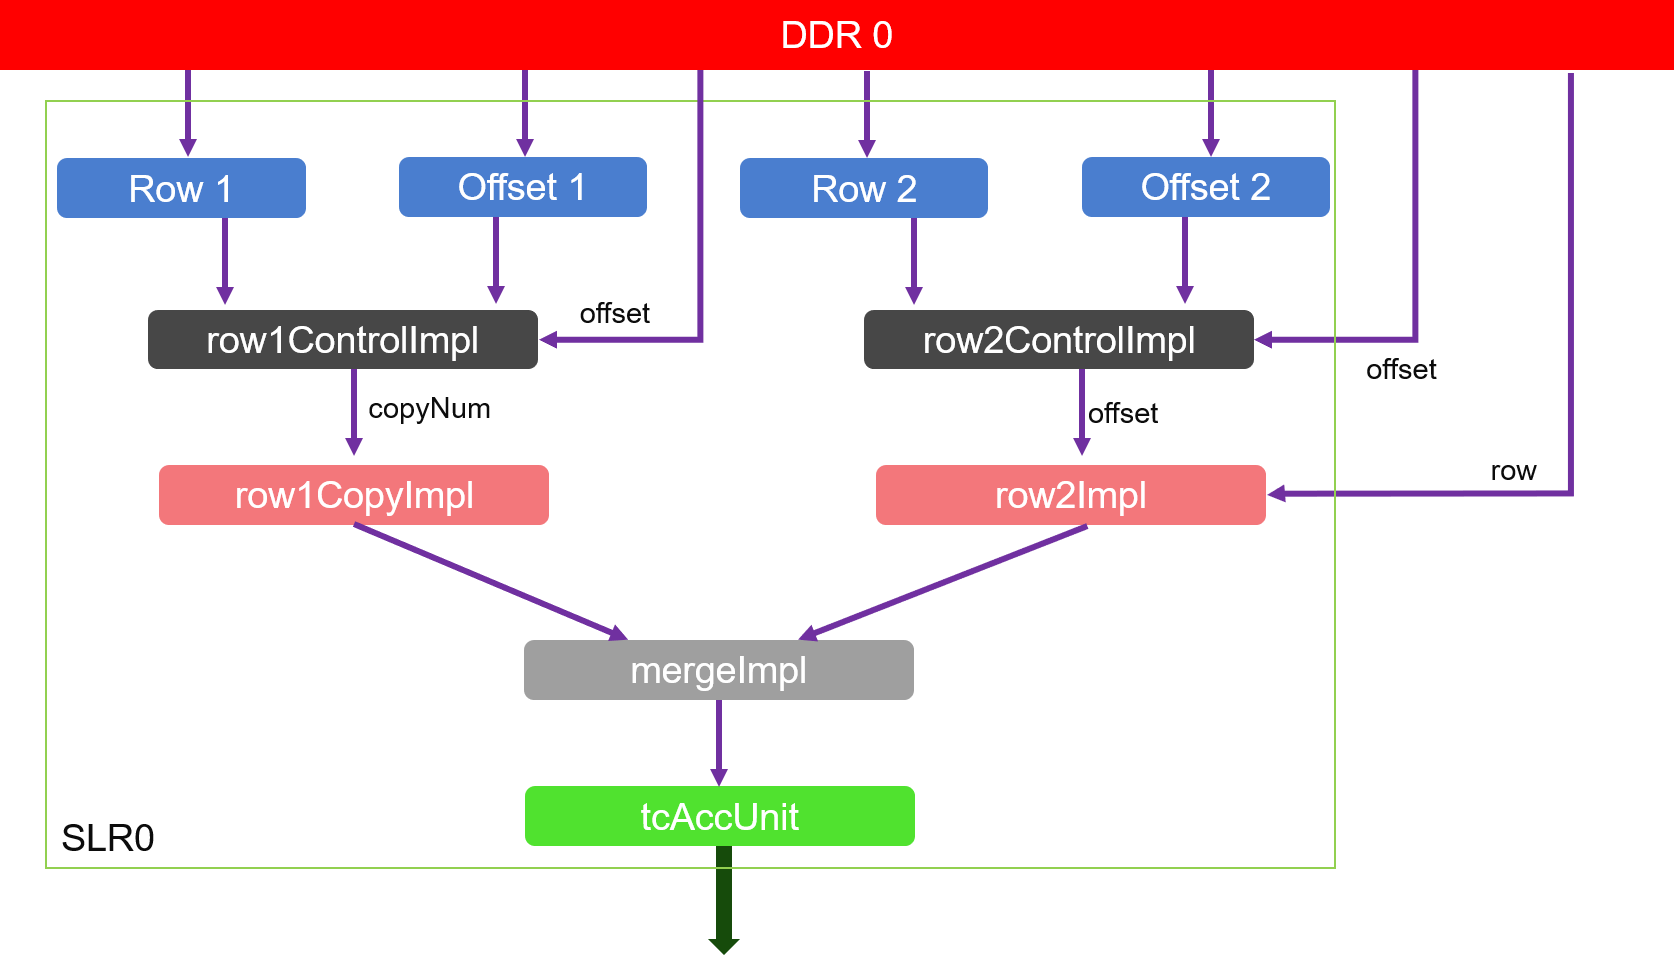
As we can see from the figure:
- Module row1CopyImpl and its previous module: first get the rows corresponding to the order of increasing columns, and then copy the rows according to the number of rows.
- Module row2Impl and its previous module: frist get the rows corresponding to the order of increasing columns, and then use the rows as columns to obtain their corresponding rows.
- Module mergeImpl and tcAccUnit: count the number of intersections of rows from module row1CopyImpl and module row2Impl in the order of the columns. The cumulative result is the number of triangles.
Profiling
The hardware resource utilizations are listed in the following table.
| Kernel | BRAM | URAM | DSP | LUT | Frequency(MHz) |
| TC_Kernel | 62 | 16 | 0 | 21001 | 300 |
Benchmark
The performance is shown in the table below.
| Datasets | Vertex | Edges | FPGA time | Spark (4 threads) | Spark (8 threads) | Spark (16 threads) | Spark (32 threads) | ||||
| Spark time | speedup | Spark time | speedup | Spark time | speedup | Spark time | speedup | ||||
| as-Skitter | 1694616 | 11094209 | 53.05 | 46.5 | 0.88 | 31.30 | 0.59 | 25.66 | 0.48 | 26.60 | 0.50 |
| coPapersDBLP | 540486 | 15245729 | 4.37 | 68.0 | 15.55 | 42.08 | 9.63 | 29.55 | 6.76 | 33.15 | 7.59 |
| coPapersCiteseer | 434102 | 16036720 | 6.80 | 74.4 | 10.94 | 38.74 | 5.70 | 37.42 | 5.50 | 33.87 | 4.98 |
| cit-Patents | 3774768 | 16518948 | 0.80 | 75.8 | 95.10 | 57.20 | 71.50 | 44.87 | 56.09 | 39.61 | 49.51 |
| europe_osm | 50912018 | 54054660 | 1.08 | 577.1 | 534.07 | 295.57 | 273.68 | 221.86 | 205.43 | 144.68 | 133.96 |
| hollywood | 1139905 | 57515616 | 113.48 | 395.0 | 3.49 | 246.42 | 2.17 | 220.90 | 1.95 | – | – |
| soc-LiveJournal1 | 4847571 | 68993773 | 21.17 | 194.3 | 9.18 | 121.15 | 5.72 | 104.64 | 4.94 | 149.34 | 7.05 |
| ljournal-2008 | 5363260 | 79023142 | 19.73 | 223.5 | 11.33 | 146.63 | 7.43 | 171.35 | 8.68 | – | – |
| GEOMEAN | 9.47 | 143.2 | 15.1X | 88.54 | 9.4X | 76.05 | 8.0X | 54.27 | 9.8X | ||
Note