Introduction to Vitis Part 2
This lab is a continuation of the previous Introduction to Vitis lab. You ended the previous lab by running a software emulation of the vector addition kernel. In this lab you will profile both software and hardware emulation and run the design in hardware.
Steps
View Emulation Timeline
-
Make sure you competed software emulation in the previous part of the lab
-
In the Assistant view, expand the following if necessary, and double-click
vadd_system > vadd > Emulation-SW > SystemDebugger_vadd_system_vadd > Run Summary (xclbin)to open Vitis Analyzer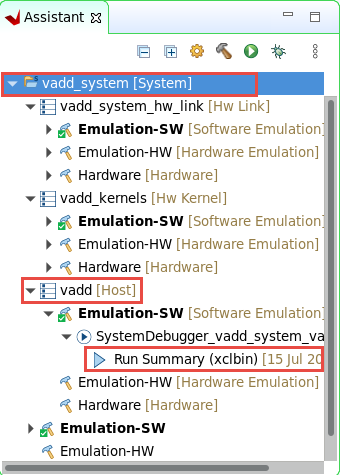
-
Vitis Analyzer shows Summary, Run Guidance and Profile Summary tabs on the left-hand side.
-
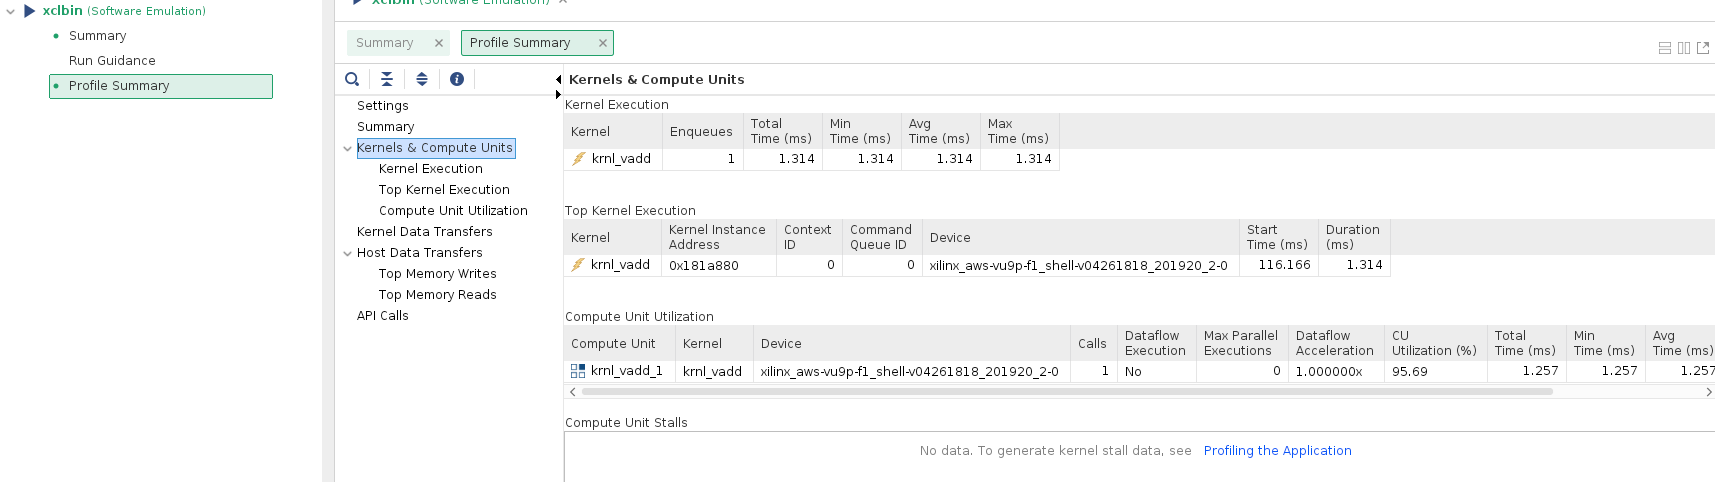
Select Profile Summary and then select Kernels & Compute Units to see kernel and compute units execution times. Notice the reported times.
-
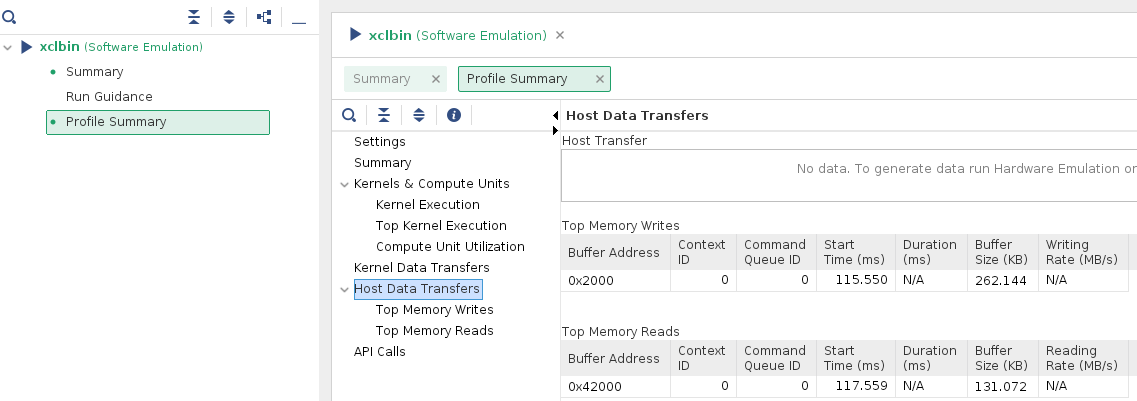
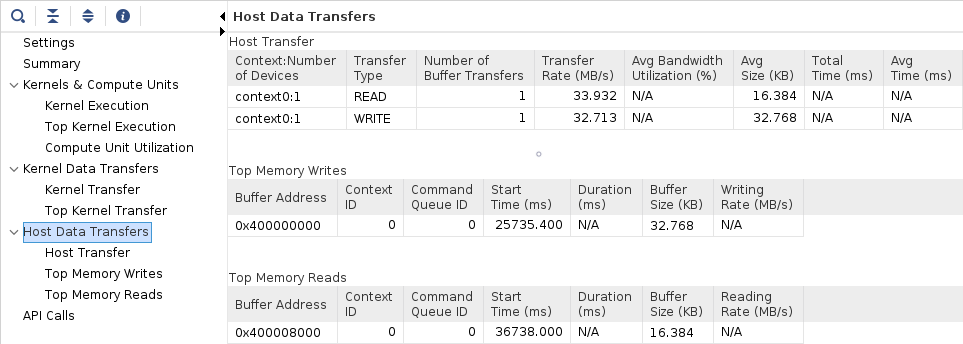
Click Host Data Transfer to see read and write buffer sizes, buffer addresses, and the related execution parameters
-
Select File > Exit to close the Analyzer
Timeline trace
In order to see a Timeline Trace, you need to enable it in the Run configuration settings.
-
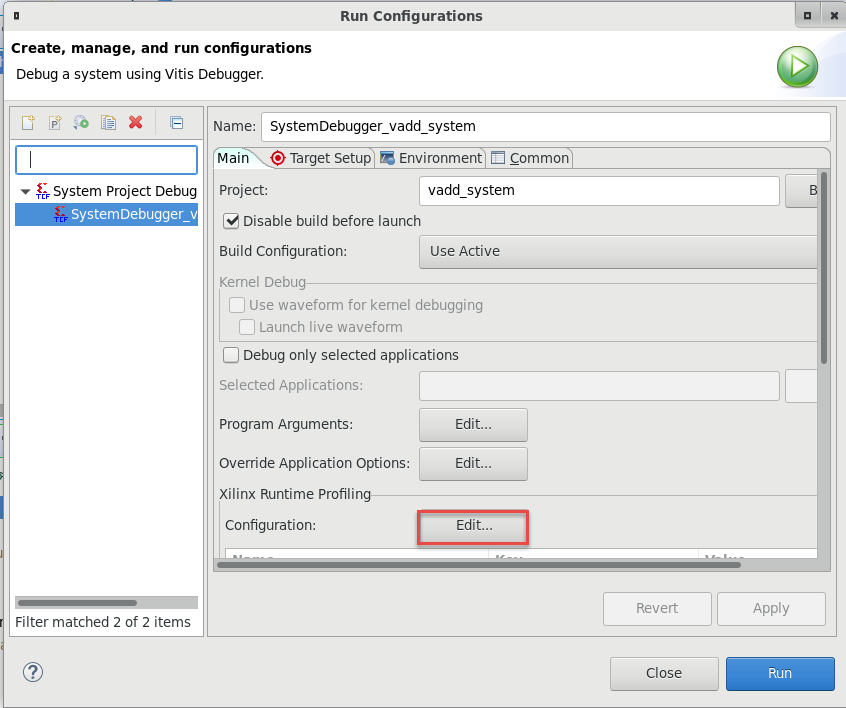
In the Assistant view, right click on vadd_system and select Run > Run configurations…
-
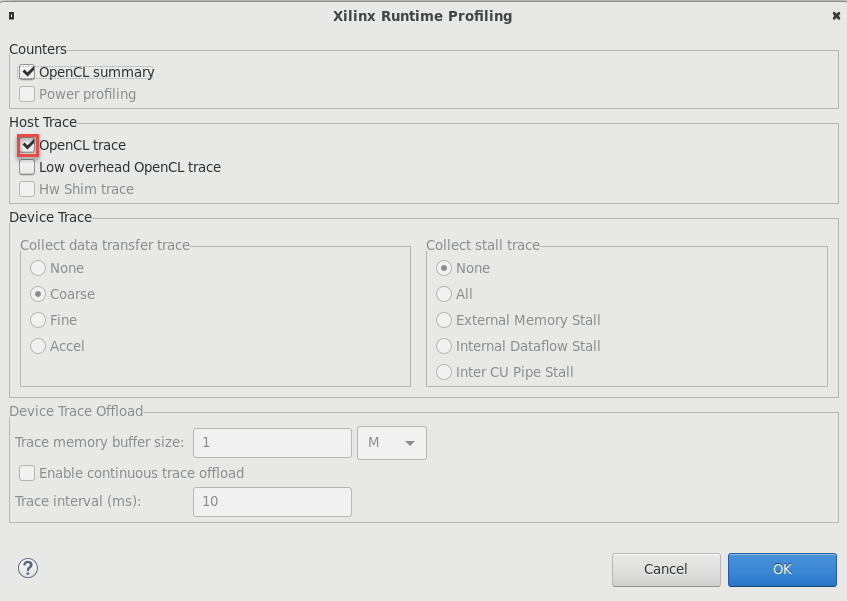
Under the Xilinx Runtime Profiling section, click the Configuration Edit… button
-
Select the OpenCL trace option, click OK to save the change and click Run
-
Open the Vitis Analyzer again (vadd_system > vadd > Emulation-SW > SystemDebugger_vadd_system_vadd > Run Summary (xclbin)) and select the Timeline Trace
-
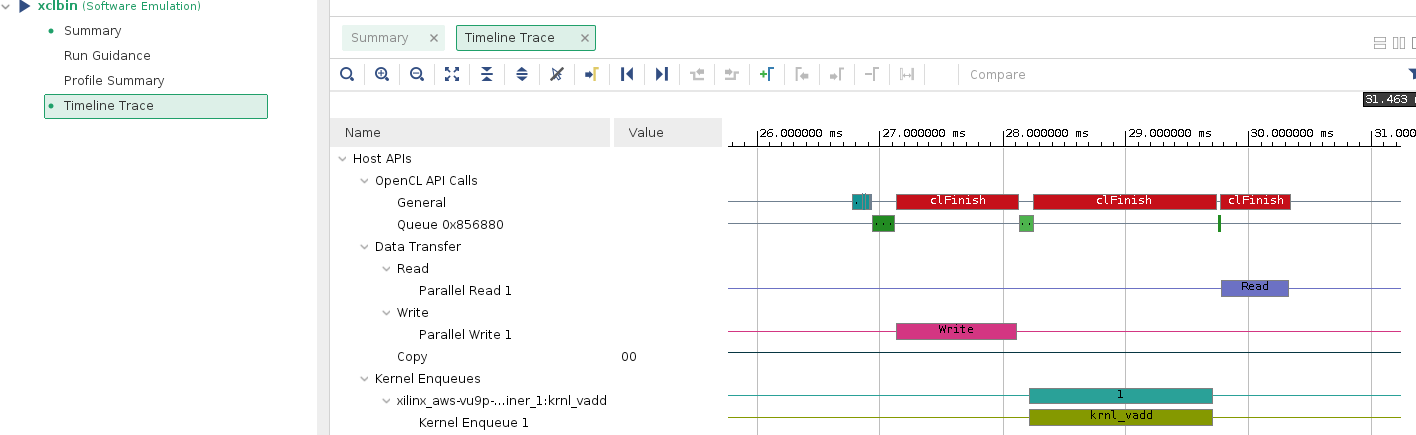
Scroll and zoom if necessary to view application events. You can select an area of interest with the mouse cursor. This is a software emulation so the absolute numbers for your timeline may vary compared to the image below
Observe the various events at different times in the trace.
-
You can close close the Vitis Analyzer when you are finished.
Build and run Hardware Emulation
-
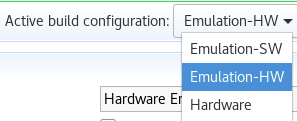
In the vadd_system panel, set the Active build configuration to Emulation-HW:
-
Build the project by selecting vadd_system in
Assistantview and clicking the build button. This may take 10 minutes
Run Hardware Emulation
-
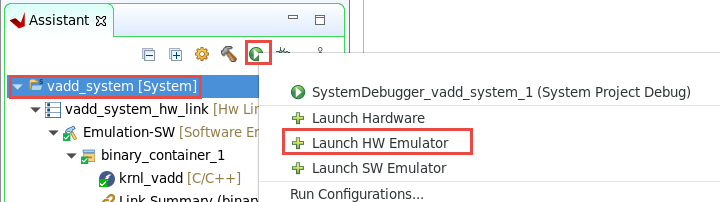
In the Assistant view, select vadd_system, then click run the button on the icon bar and select Launch HW Emulator
-
Observe the application has run, and the output is displayed in the Console view. Compared to software emulation, the output also shows data transfer information. Notice the data transfer between kernel and global memory is 32KB read (16KB each for A and B) and 16 KB write (C)
Found Platform
Platform Name: Xilinx
INFO: Reading /home/ec2-user/workspace/vadd_system/Emulation-HW//binary_container_1.xclbin
Loading: '/home/ec2-user/workspace/vadd_system/Emulation-HW//binary_container_1.xclbin'
Trying to program device[0]: xilinx_aws-vu9p-f1_shell-v04261818_201920_2
INFO: [HW-EM 01] Hardware emulation runs simulation underneath. Using a large data set will result in ...
Device[0]: program successful!
Running Vector add with 4096 elements
Launching Hardware Kernel...
Getting Hardware Results...
TEST PASSED
INFO::[ Vitis-EM 22 ] [Time elapsed: 0 minute(s) 30 seconds, Emulation time: 0.137666 ms]
Data transfer between kernel(s) and global memory(s)
krnl_vadd_1:m_axi_gmem-DDR[1]          RD = 32.000 KB              WR = 16.000 KB

INFO: [HW-EM 06-0] Waiting for the simulator process to exit
INFO: [HW-EM 06-1] All the simulator processes exited successfully
View the Timeline Trace
-
In the Assistant view, double-click
vadd_system > vadd > Emulation-HW > SystemDebugger_vadd_system_vadd > Run Summary (xclbin)to open Vitis Analyzer -
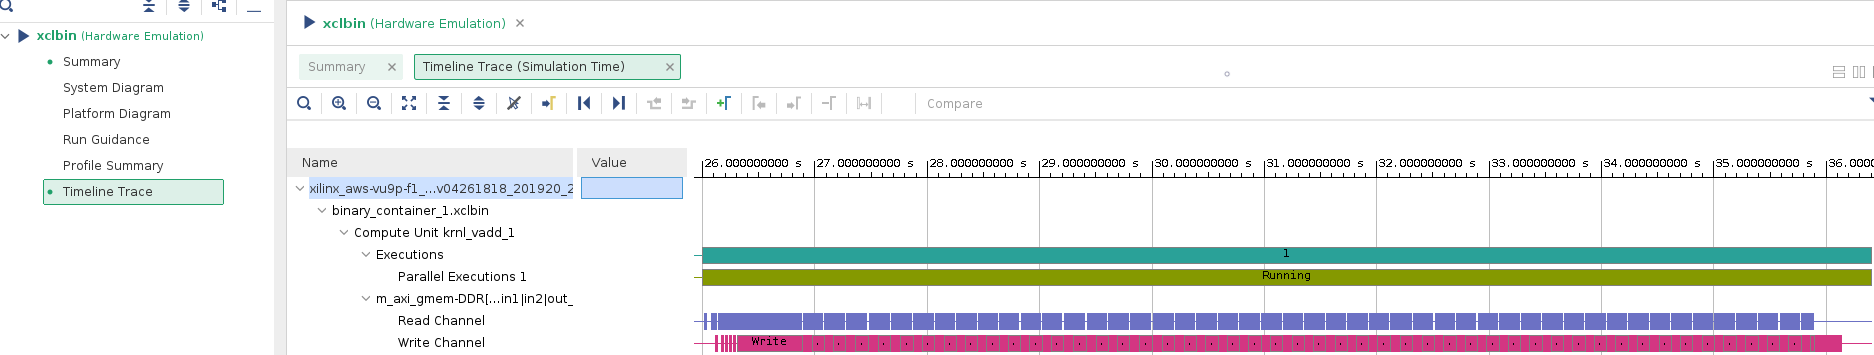
Click on the Timeline Trace
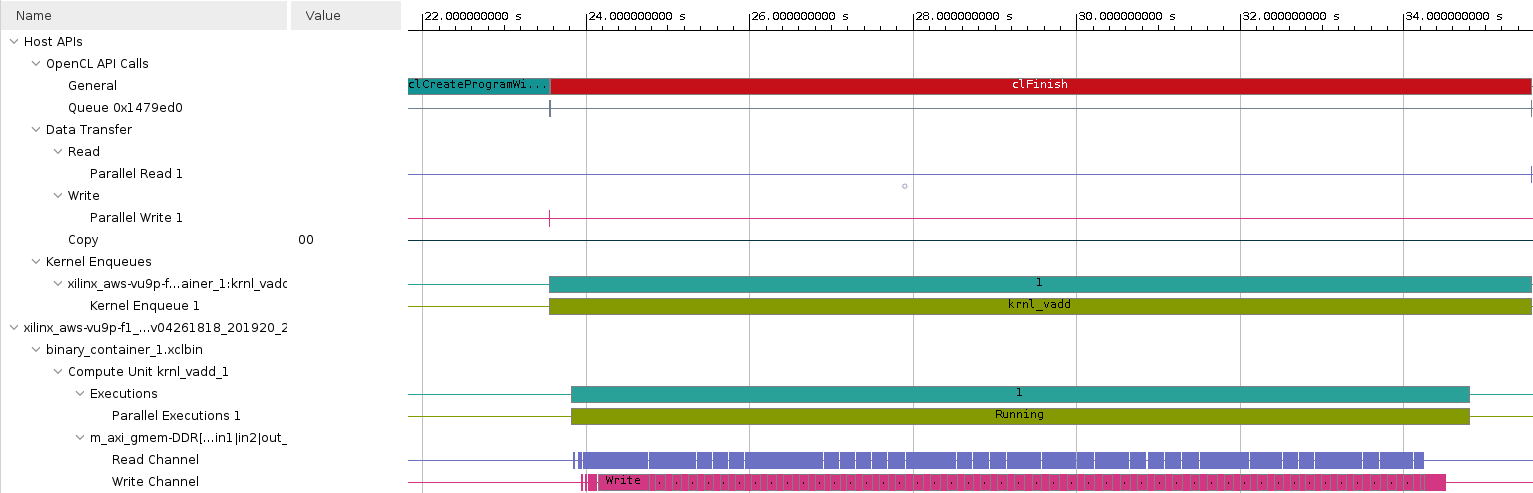
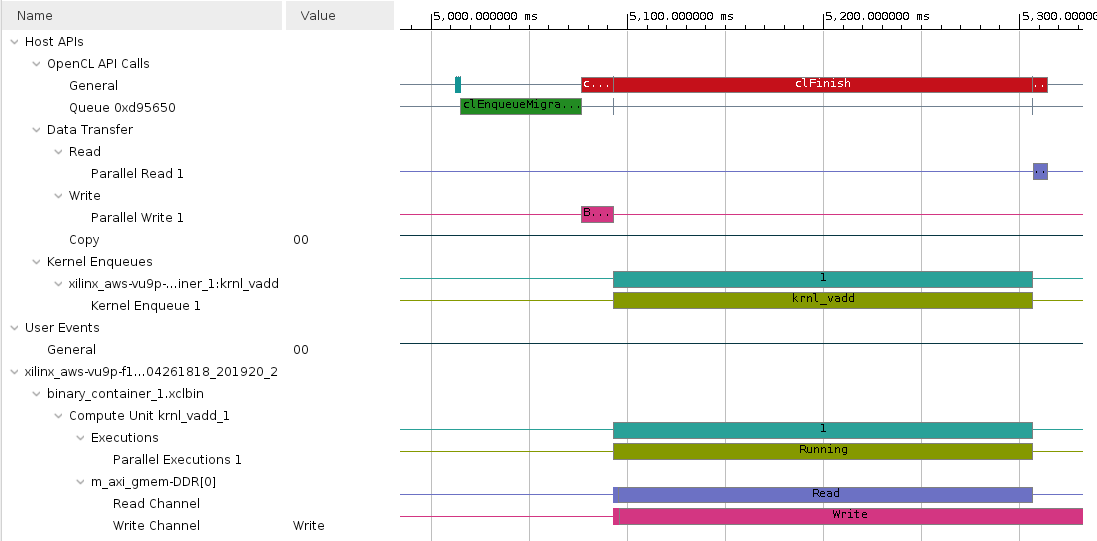
Scroll and Zoom (25-35 seconds in the image below) and observe the events that occurred. Note that data is processed in smaller chunks in the kernel and in a sequential manner. Notice the Only events related to the FPGA hardware are shown. No host events are visible in this view
-
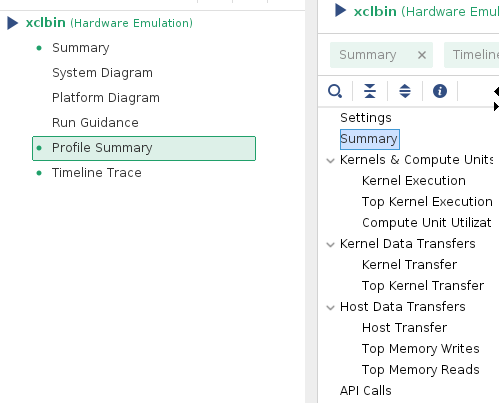
Click on Profile Summary entry in the left panel, and observe different entries, each containing reports on various performance metrics, we will focus on four of them
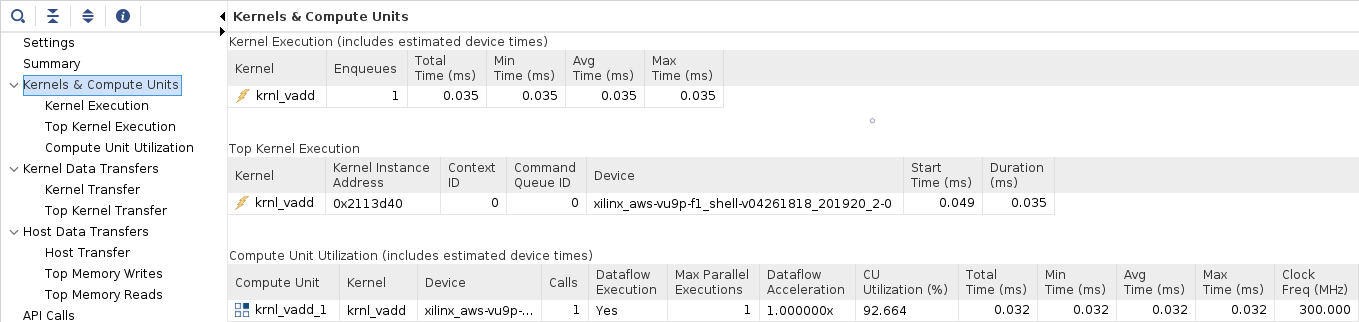
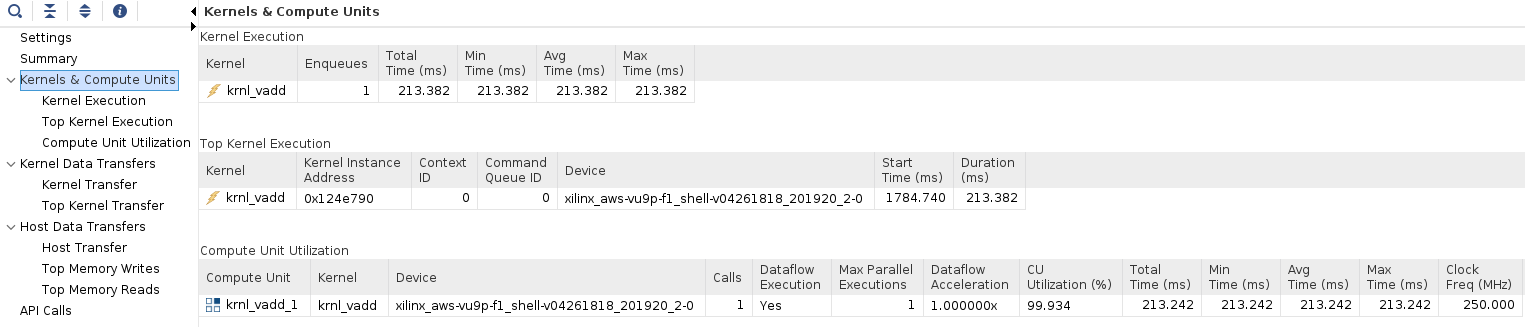
- Kernels & Compute Units : Shows the number of times the kernel was executed. Includes the total, minimum, average, and maximum run times. If the design has multiple compute units, it will show each compute unit’s utilization. When accelerating an algorithm, the faster the kernel executes, the higher the throughput which can be achieved.
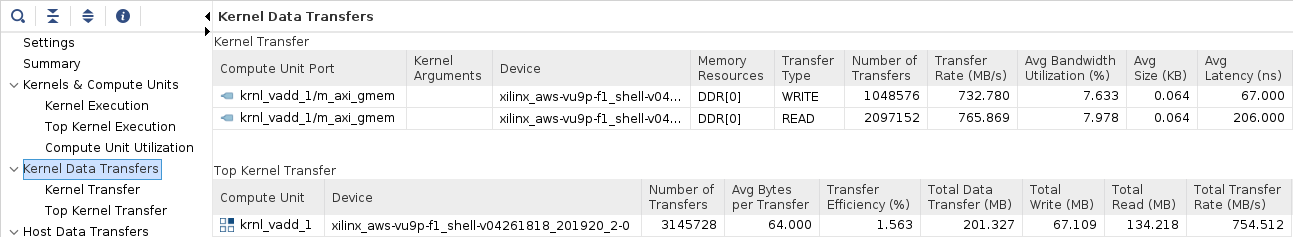
- Kernel Data Transfers : This report has no bearing in software emulation as no actual data transfers are emulated across the host to the platform. In hardware emulation, this shows the emulated throughput and bandwidth of the read/writes to the global memory that the host and kernel share
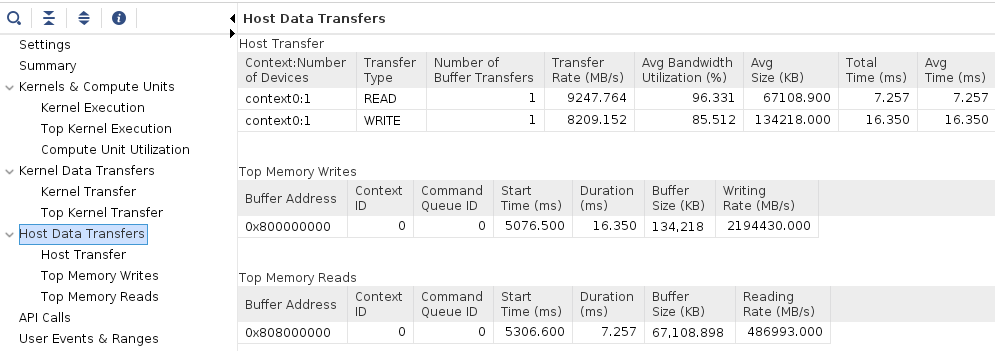
- Host Data Transfer : Shows the top operations related to memory transfer between the host and kernel to global memory, and kernel execution. This allows you to identify throughput bottlenecks when transferring data. Efficient transfer of data to the kernel/host allows for faster execution times
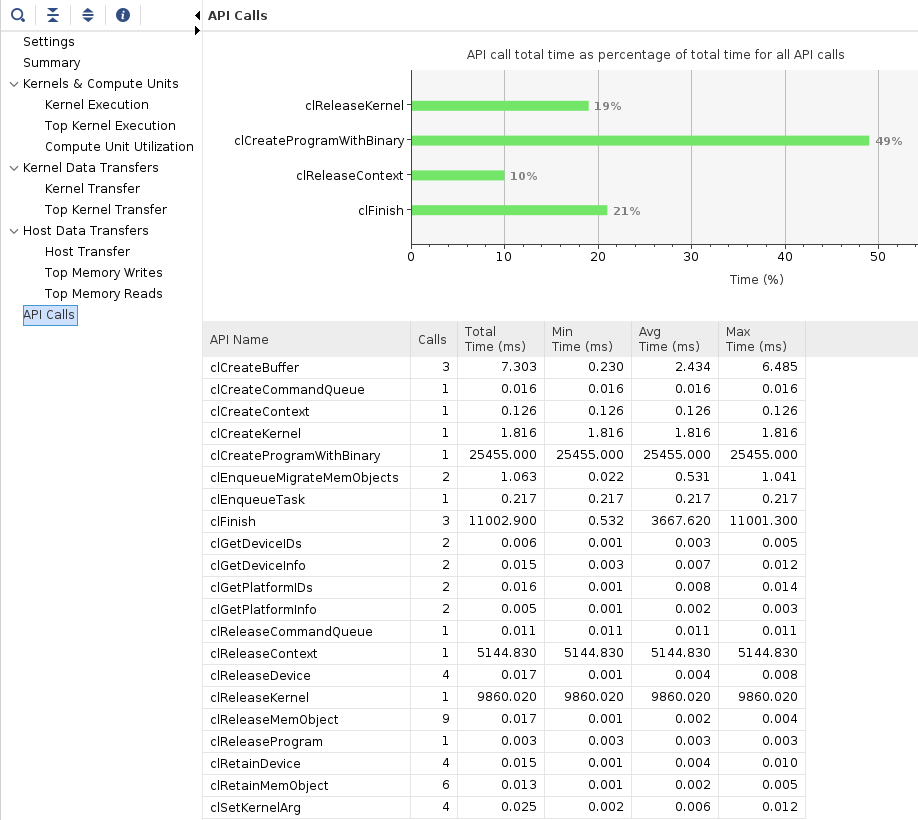
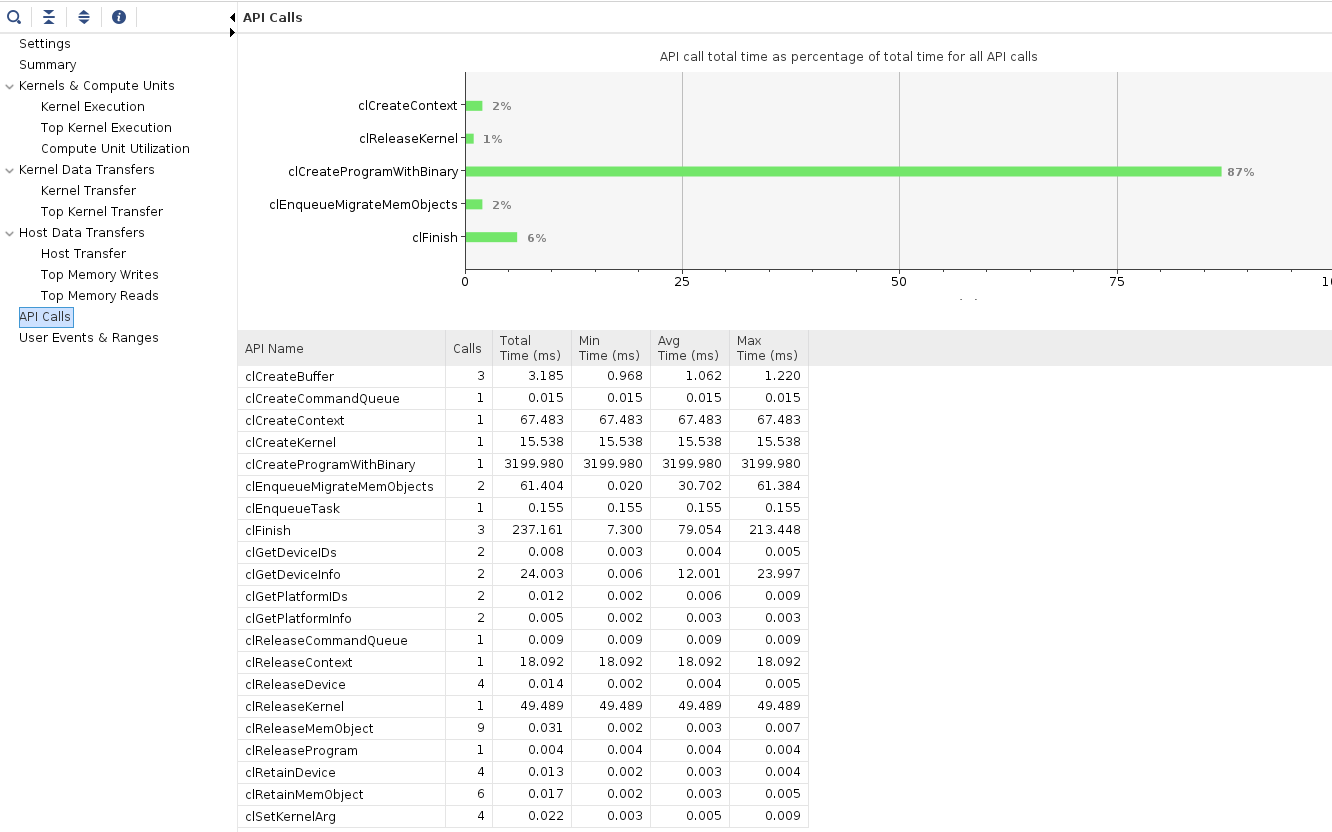
- API Calls : Shows all the OpenCL API command executions, how many times each was executed, and how long they take to execute
-
Click on each of tabs and review the report
- Kernels & Compute Units
- Kernel Data Transfers
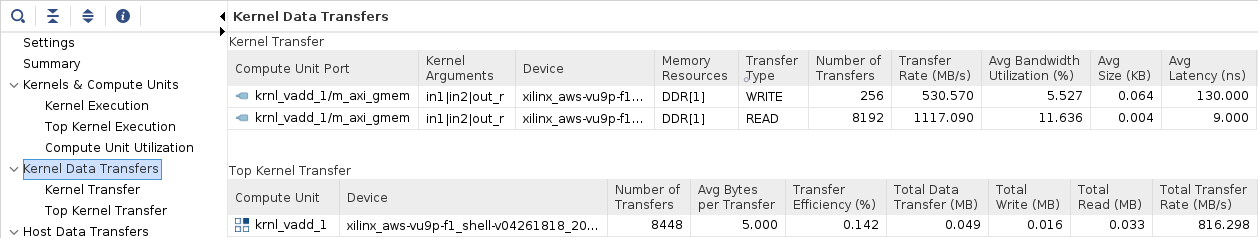
Notice that the number of transfers is 256 in the write channel, this is because Vitis is optimizing the write channel applying bursts to move 16 elements for each transfer with a single request. Transferring data in bursts hides the memory access latency and improves bandwidth usage and efficiency of the memory controller. This optimization cannot be applied to the read channel because of a memory bank limitation, as you will see in the next lab.
- Host Data Transfer
- OpenCL APIs
-
Close the analyzer when you are finished
Host profiling
-
In order to see host events, enable OpenCL trace again for a HW emulation run. In the Assistant view, right click on vadd_system select Run > Run Configurations…. Notice a new configuration is created for the HW emulation
-
In the Xilinx Runtime Profiling section, click on the
Edit...button, then select the OpenCL trace option and click OK -
Rerun and double-click
vadd_system > vadd > Emulation-HW > SystemDebugger_vadd_system_vadd > Run Summary (xclbin)to open Vitis Analyzer. Select theTimeline Tracepanel on the leftObserve the various events occurring in various parts (host, kernels) of the system at different time intervals
Run the system in hardware
Building the hardware can take 1-2 hours. You will test the design in hardware using a prebuilt binary. You will also setup the run configuration so you can run the application and then analyze results from GUI.
If you wish to rebuild the hardware later, see the Appendix below for instructions on how to do this.
-
Copy the prebuilt solution files into the project with the following commands:
mkdir -p ~/workspace/vadd/Hardware && mkdir -p ~/workspace/vadd_system/Hardware cp ~/xup_compute_acceleration/solutions/vitis_intro_lab/* ~/workspace/vadd/Hardware/ cp ~/xup_compute_acceleration/solutions/vitis_intro_lab/binary_container_1.awsxclbin ~/workspace/vadd_system/Hardware/binary_container_1.xclbin -
Set
Active build configuration:toHardwareon the upper right corner of Application Project Settings view
-
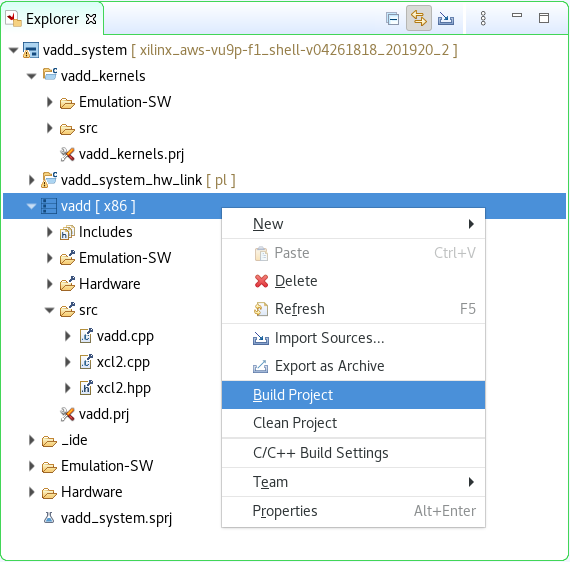
In the Explorer view, right click on vadd and select Build Project to rebuild the host application only.
-
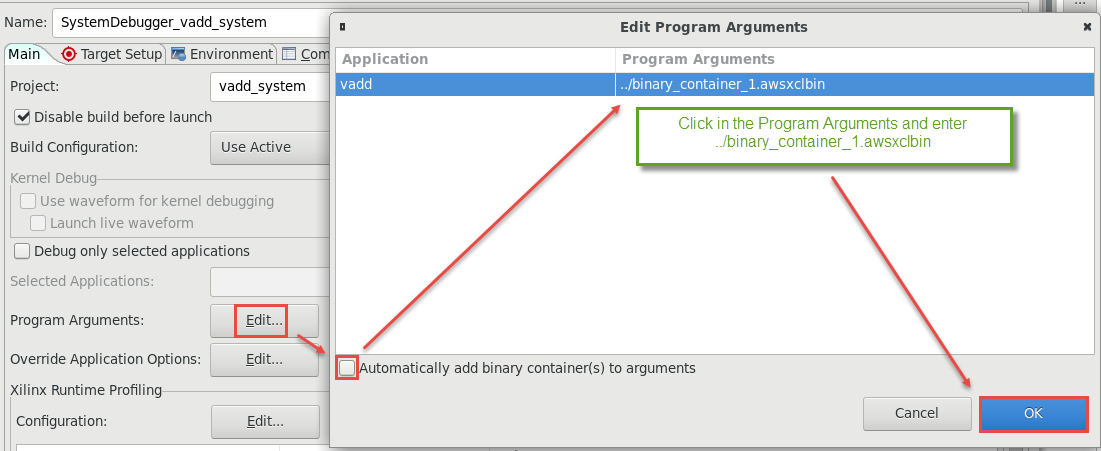
In the Assistant view, right-click on
vadd_systemand select Run > Run Configurations… -
Click on the Edit… button of the Program Arguments, uncheck Automatically add binary container(s) to arguments, then enter ../binary_container_1.awsxclbin after clicking in the Program Arguments field. Finally, click OK
-
Click on the
Edit...button of the Xilinx Runtime Profiling section, select the OpenCL trace option and click OK -
Execute the application by clicking Apply and then Run. The FPGA bitstream will be downloaded and the host application will be executed showing an output similar to:
Loading: '/home/centos/workspace/vadd_system/Hardware/binary_container_1.awsxclbin' Trying to program device[0]: xilinx_aws-vu9p-f1_shell-v04261818_201920_2 Device[0]: program successful! Running Vector add with 16777216 elements Launching Hardware Kernel... Getting Hardware Results... TEST PASSED -
In the Assistant view, double click
vadd_system > vadd > Hardware > SystemDebugger_vadd_system_vadd > Run Summary (xclbin)to open the Vitis Analyzer -
Click Timeline Trace.
Zoom in at the end of the timeline and observe the activities in various parts of the system. Note that the kernel processes data in one shot
-
Click on the Profile Summary entry in the left panel, and check information reported in each of the four sections:
- Kernels & Compute Units
- Kernel Data Transfers
- Host Data Transfer
- OpenCL APIs
-
Close the Analyzer when finished
-
In the Explorer view, review the
xrt.inifile within thevadd_system > vadd [x86] > HardwarefolderEarlier, when you set kernel profiling and trace settings, the
xrt.inifile is automatically generated. During the execution, this file is used to generate the profile and application timeline data which are seen using Vitis Analyzer. Find our more about this file here.[Debug] opencl_summary=true power_profile=false opencl_trace=true lop_trace=false xrt_trace=false data_transfer_trace=coarse stall_trace=off app_debug=true
Conclusion
In this lab you ran the vector add kernel using the hardware emulation flow, and reviewed the reports. Then, you used a precompiled solution to download the application and kernel onto the AWS F1 instance and validated the functionality in hardware. You also analyzed profile and application timeline reports generated when running the application in actual hardware.
Appendix: Build Full Hardware
Note that building the project can take around two hours. Skip this step in a tutorial environment.
-
Set
Active build configuration:toHardwareon the upper right corner of Application Project Settings viewIn order to collect the profiling data and run Timing Analyzer on the application run in hardware, we need to setup some options.
-
Select
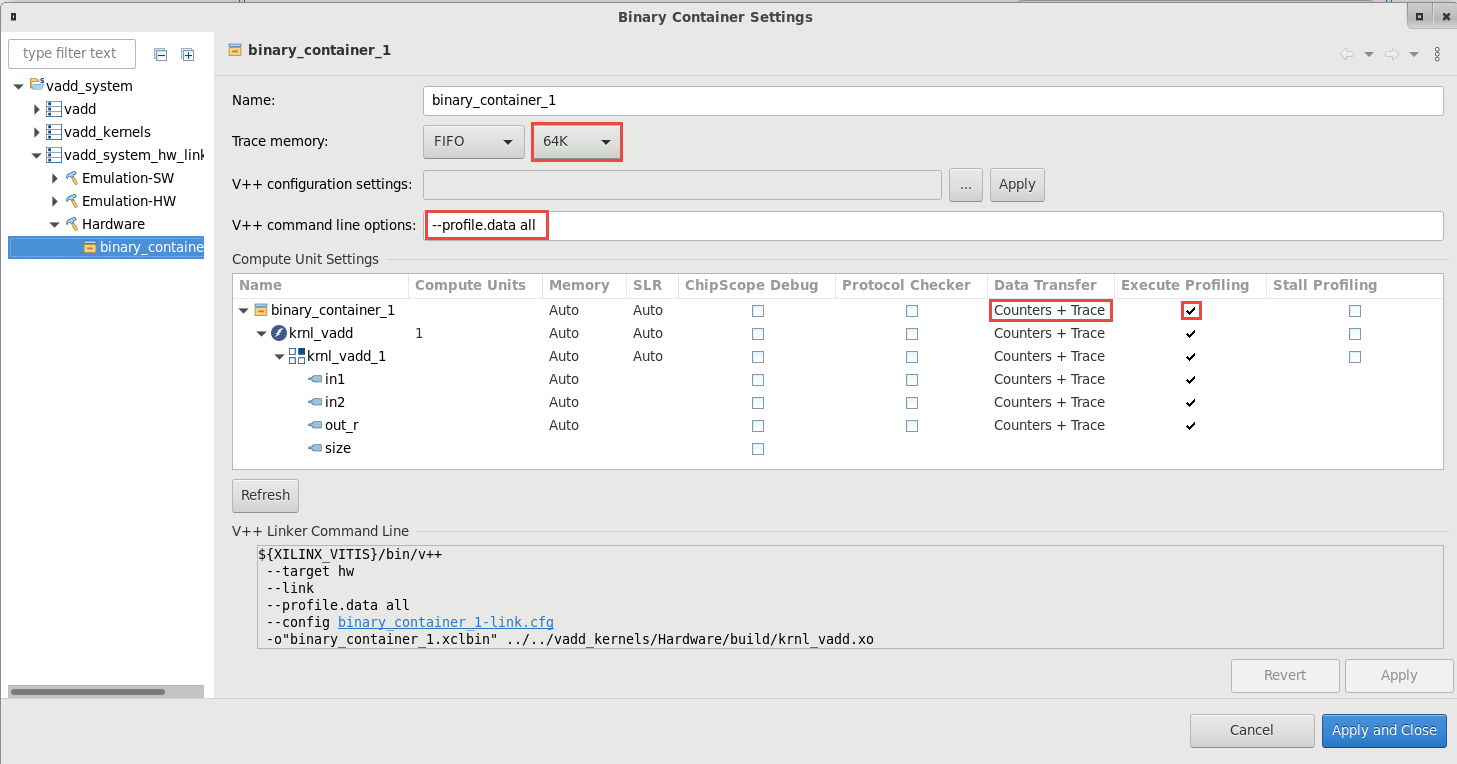
vadd_system > vadd_system_hw_link > Hardware > binary_container_1in Assistant view and then click on Settings. Click on the Data Transfer drop-down button in binary_container_1 row and select Counters+Trace option. This should also enable Execute Profiling option. If not, then click on the corresponding check box. -
In the V++ command line options: field, enter
--profile.data allto enable kernel profiling -
Select Trace Memory to be FIFO type and size of 64K. This is the memory where traces will be stored. You also have the option to store this information in DDR (max limit 4 GB) and PLRAM
At this point the settings should look like shown below
-
Click Apply and Close
-
Build the project by selecting vadd_system in Assistant view and clicking the build button (
 )
)This will build the project under the Hardware directory. The built project will include vadd (executable) file along with the binary_container_1.xclbin file
-
A
binary_container_1.xclbinandvaddapplication will be generated in thevadd/Hardwaredirectory
Test on AWS (create AFI)
Before the design can be run on AWS F1 an AFI (Amazon FPGA Image) is required
Once the full system is built, you can create an AFI by following the steps listed in create an AFI
Copyright© 2021 Xilinx