Hardware/Software Debugging
Introduction
This lab is a continuation of the previous RTL Kernel Wizard Lab lab. You will use ChipScope to monitor signals at the kernel interface level and perform software debugging using Vitis.
Objectives
After completing this lab, you will be able to:
- Add ChipScope cores to a design created using Vitis
- Use ChipScope to monitor signals at the kernel interface
- Debug a software application in Vitis
Steps
Open Vitis and import the project
To save time on compilation, a precompiled project will be provided with the ChipScope debug cores already included in the design. See Appendix to learn how to add ChipScope debug cores
Note: If you are doing this lab in a new workspace, you must add the targeted platform first after opening Vitis
- Continue with the same workspace
~/workspace - Click File > Import…
- In the Import Projects window, select Vitis project exported zip file and click Next
- Click on Browse… and select debug_system.ide.zip from
~/xup_compute_acceleration/solutions/debug_laband click OK. Make sure that the three hierarchical options are checked - Click Finish
Hardware Debugging
Build Hardware
Review the Appendix to understand how to add the ChipScope Debug bridge core and build the project. As this steps takes around two hours. A precompiled solution with the debug core is provided
Run the application
- In Assistant view, right click on debug_system and select Run > Run Configurations…
- Double-click on System Project Debug in the left panel to create a new run configuration
- Click on the Edit… button of the Program Arguments, uncheck Automatically add binary container(s) to arguments, then enter ../binary_container_1.awsxclbin after clicking in the Program Arguments field. Finally, click OK
-
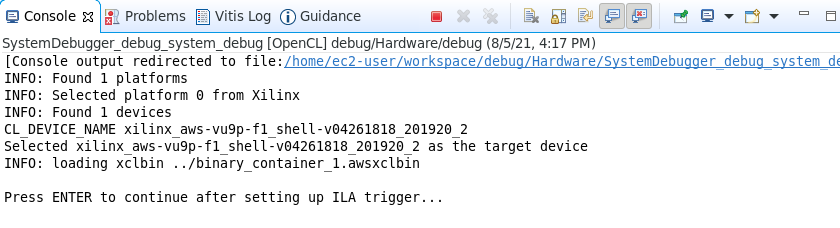
Execute the application by clicking Apply and then Run
The host application will start executing, load the bitstream, and wait for user input (press any key to continue)
Set up the Xilinx Virtual Cable (XVC)
The Xilinx Virtual Cable (XVC) is a virtual device that gives you JTAG debug capabilities over PCIe to the target device. XVC will be used to debug the design.
XVC for AWS
Open a new terminal window and run the following script which will manage setup of the XVC:
sudo fpga-start-virtual-jtag -P 10200 -S 0
The output should look like:
Starting Virtual JTAG XVC Server for FPGA slot id 0, listening to TCP port 10200.
Press CTRL-C to stop the service.
Skip the next section and continue with Connecting Vivado to the XVC
XVC for Alveo U200
For an Alveo board, you need to determine the XVC device in your system. XVC is installed as part of the Vitis and XRT installation.
ls /dev/xfpga/xvc_pub*
This will report something similar to the output below:
/dev/xfpga/xvc_pub.u513
Each computer may have a different value for xvc_pub.* so you will need to check the name for your computer.
Run the following command, to start a virtual jtag connection (where u513 should be the value your obtained from the previous command):
debug_hw --xvc_pcie /dev/xfpga/xvc_pub.u513 --hw_server
The Virtual JTAG XVC Server will start listening to TCP port 10200 in this case. This is the port you will need to connect to from Vivado. Note the hw_server is listening to TCP port 3121. See example output below
launching xvc_pcie...
xvc_pcie -d /dev/xfpga/xvc_pub.u513 -s TCP::10200
launching hw_server...
hw_server -sTCP::3121

****************************
*** Press Ctrl-C to exit ***
****************************
Connecting Vivado to XVC
-
Start Vivado from another terminal
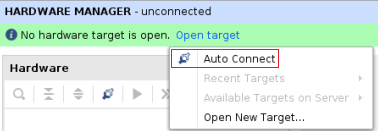
vivado - Click on Open Hardware Manager >
-
Click Open target > Auto Connect
-
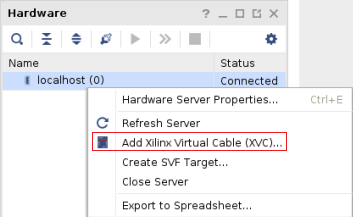
Right click on localhost (0) and select Add Xilinx Virtual Cable (XVC)…
-
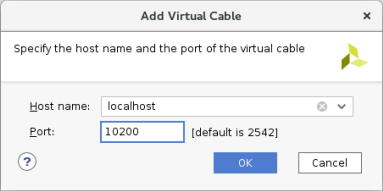
Enter localhost as the host name, and 10200 as the port (or the port number for your machine obtained previously) and click OK
-
Right click on the debug_bridge and select Refresh Device.
The Vivado Hardware Manager should update showing Hardware, Waveform, Settings-hw, Trigger-Setup windows. The Hardware window also shows the detected ILA cores (hw_ila_*), inserted in the design. The Alveo design will have one ILA, whereas, the AWS design will have two ILAs, one monitoring the AWS shell interface (hw_ila_2) and other the KVAdd kernel (hw_ila_1)
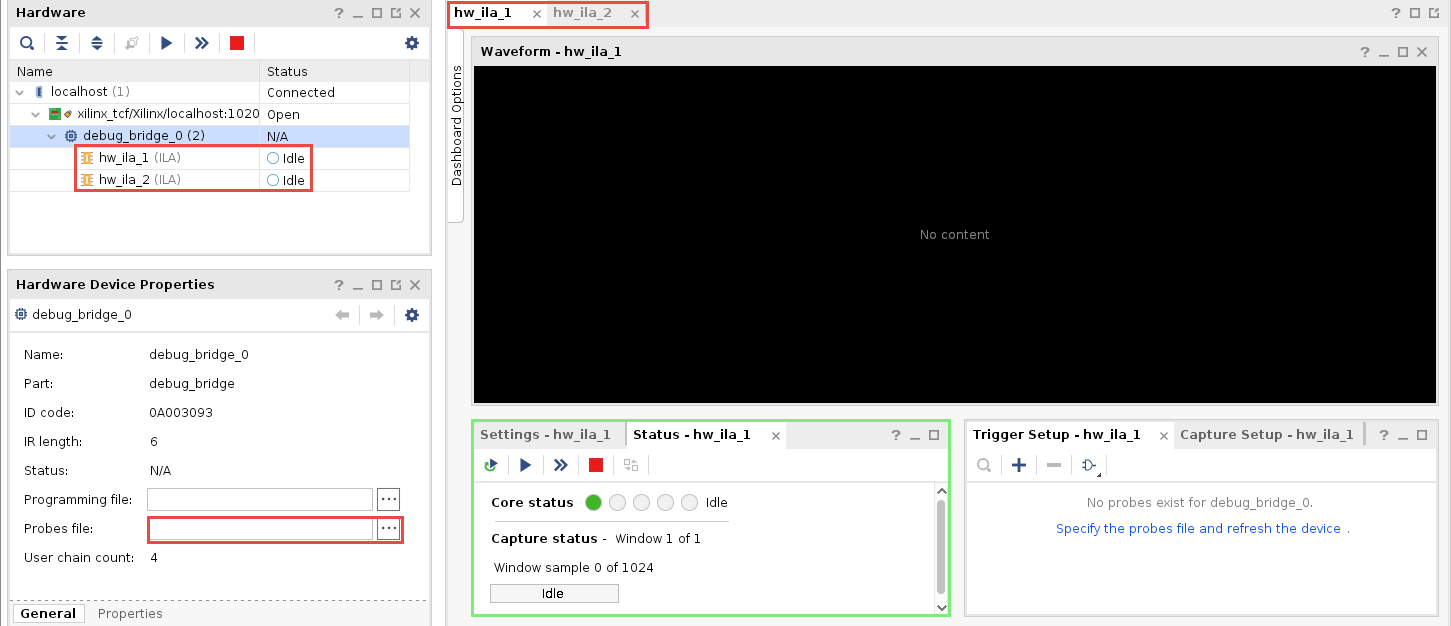
- Select the debug_bridge in the Hardware panel
- In the Hardware Device Properties view, click on the browse button (…) beside Probes file
- Browse to the project’s ~/workspace/debug_system_hw_link/Hardware folder, select the binary_container_1.ltx file and click OK
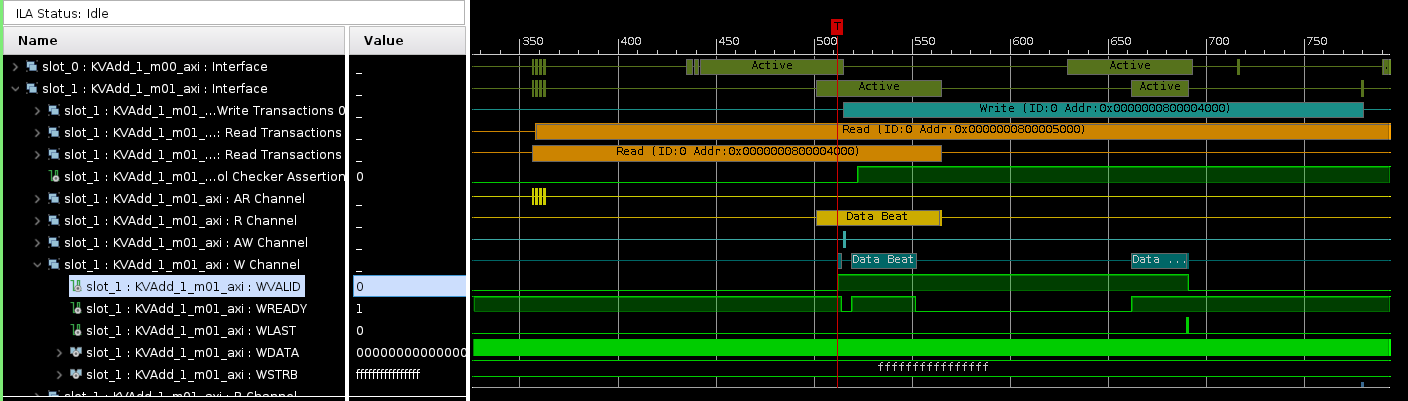
- Select the hw_ila_1 tab, and notice four (Slot_0 to Slot_3) probes are filled in the Waveform window
-
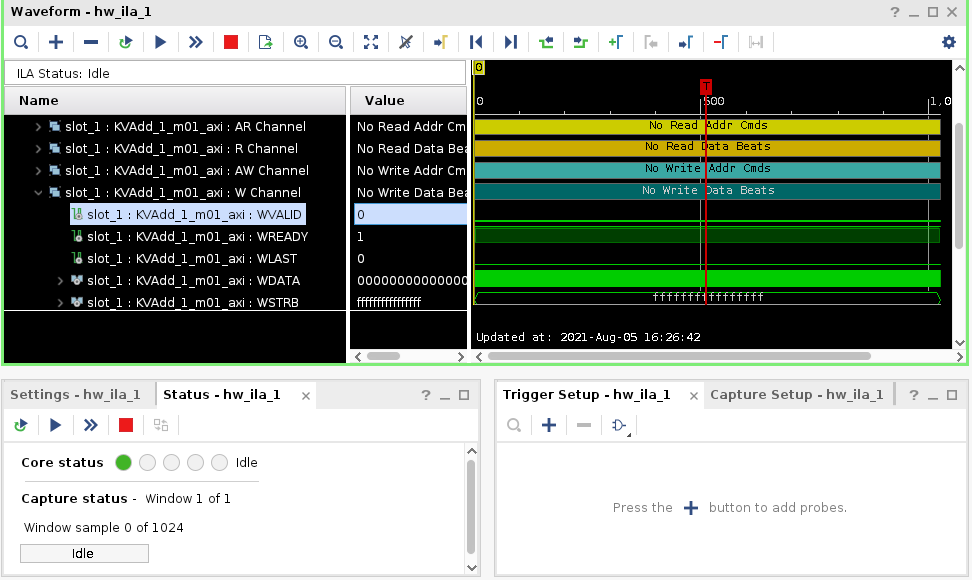
Click on the Run Trigger immediate button and observe the waveform window is fills with data showing that the four channels were Inactive for the duration of the signal capture
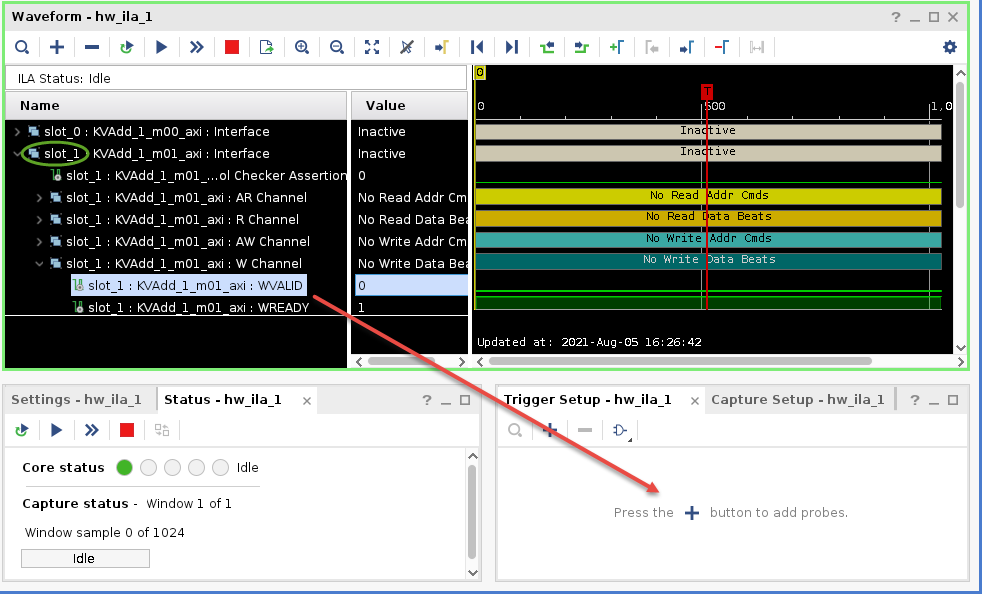
- Expand slot_1 : KVAdd_1_m01_axi : Interface , then find and expand slot_1 : KVAdd_1_m01_axi : W Channel in the Waveform window
-
Select the WVALID signal and drag it to the Trigger Setup - hw window
-
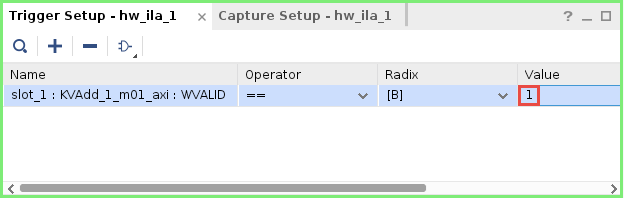
Click on drop-down button of the Value field and select trigger condition value as 1
-
Click on the Run trigger button
 and observe the hw_ila_1 probe is waiting for the trigger condition to occur
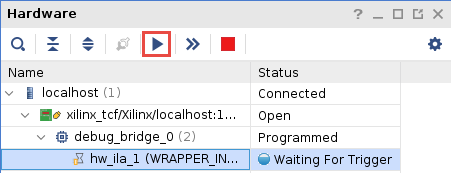
-
Switch to the Vitis GUI, and select Console view and press the Enter key to allow the program to continue executing
Observe that the program completes displaying INFO: Test completed successfully in the Console window
-
Switch back to Vivado and notice that because the trigger condition was met, the waveform window has been populated with new captured data
-
Expand Slot_0, slot_1, and slot_2 groups, zoom in to the region around samples 450 to 1000, and observe the data transfers taking place on each channels. Also note the addresses from where data are read and where the results are written to
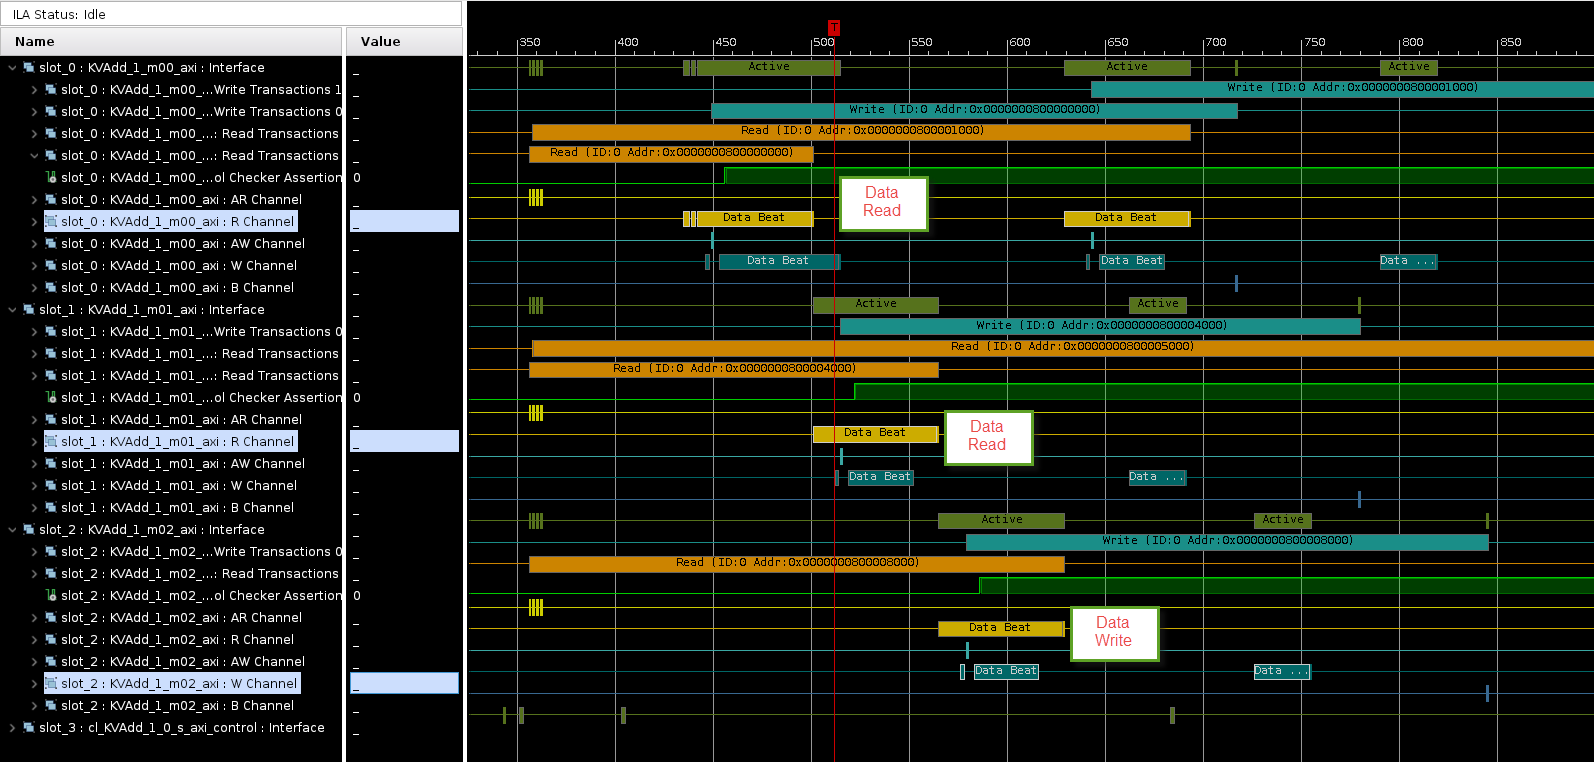
- Zoom in on one of the transactions and hover your mouse at each successive sample and notice the data content changing
- When you are finished, close Vivado Manager by selecting File > Exit
- Close the jtag probe by switching to its terminal window and pressing Ctrl-C
Perform Software Debugging
-
Switch to the Vitis GUI
-
From Explorer view, Open
debug_system > debug > src > host_example.cpp -
Comment out lines 248-249 and save the file
-
In Assistant view, select on
debug_system > debugand build the application since we changed it -
In Assistant view, right click on debug_system and select Debug > Debug Configurations…
-
Make sure that the Program Arguments is set to ../binary_container_1.awsxclbin
-
Click Apply, if needed, and then click Debug
-
Click Yes, if prompted to switch to the Debug perspective
The bitstream will be downloaded to the FPGA and the host application will start executing, halting at main() entry point
-
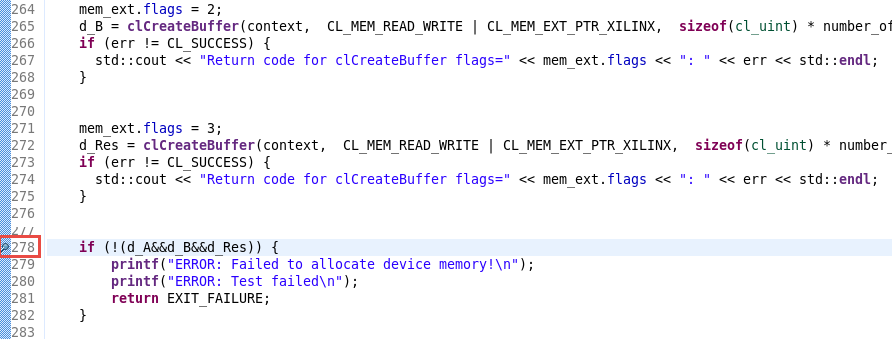
In host_example.cpp view scroll down to line ~278 and double-click on the left border to set a breakpoint. At this point, three buffers would have been created
-
Click on the Resume button or press F8
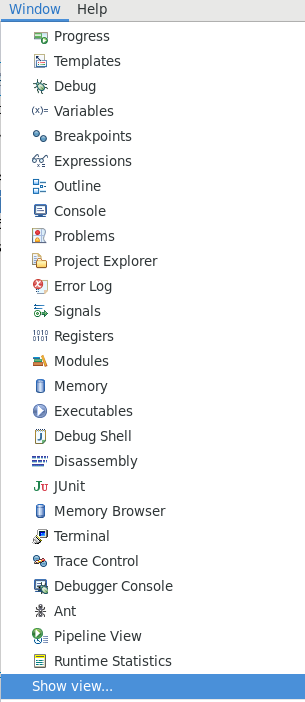
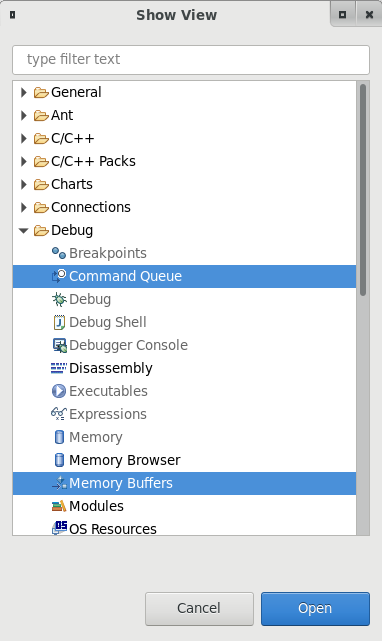
The program will resume executing and stop when it reaches the breakpoint. At this point you can click on the various monitoring tabs (Variables, Command Queue, Memory Buffers etc.) and see the contents currently in scope. If you don’t see them, then select Windows > Show view… and then select the missing views
Vitis debug allows command queues and memory buffers to be examined as the program execution progresses
-
Set a breakpoint at line 343 and press F8 or Resume button
The execution will progress and stop at line 343
-
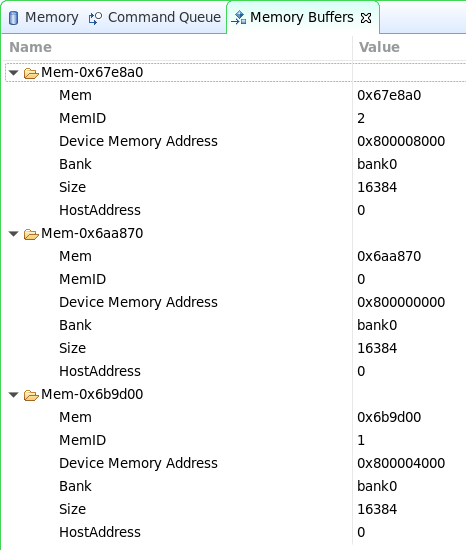
Select the Memory Buffers tab
Notice that three buffers are allocated, their IDs, DDR memory address, and sizes are shown. The Mem member may be different in your execution, but Device Memory Address member should be identical for each of the three buffers
-
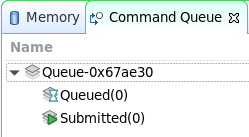
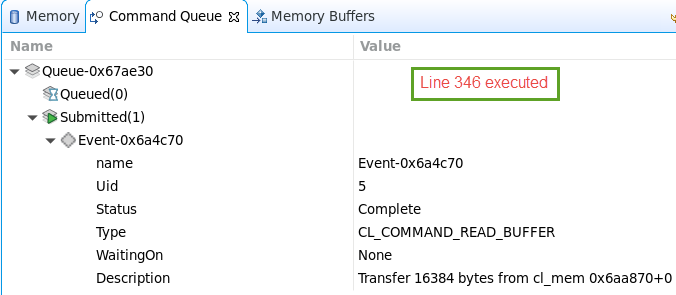
Select the Command Queue tab and notice that there no commands enqueued.
Lines ~346-350 creates commands to read the data and results
err |= clEnqueueReadBuffer( ... ); -
Set a breakpoint on line 348 and press F8 or Resume button to execute to the first
clEnqueueReadBuffer()to create a read buffer command for reading operand d_ANotice the Command Queue tab shows one command submitted
-
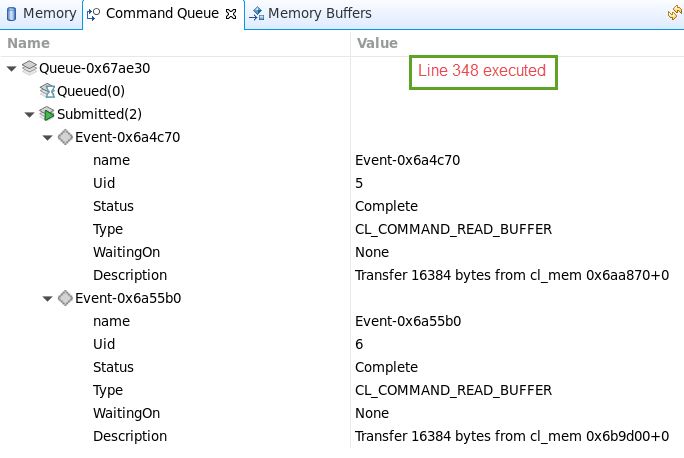
Press F6 to execute the next
clEnqueueReadBuffer()for d_BNotice the Command Queue tab shows two commands submitted
-
Set a breakpoint at line ~404 (
clReleaseKernel()) and press F8 to resume the executionNotice that the Command Queue tab still shows entries
-
Press F6 to execute
clReleaseKernel()Notice the Memory Buffers tab is empty as all memories are released. Note: Since there is a bug in the IDE, this step may or may not work properly. Click the disconnect button if it fails and skip next step
-
Click F8 to complete the execution
-
To change perspective, click on Design in the top right corner of Vitis GUI
Conclusion
In this lab, you used the ChipScope Debug bridge and cores to perform hardware debugging. You also performed software debugging using the Vitis GUI.
Appendix-I
Steps to Add ChipScope Debug core and build the design
- Set target to Active build configuration: to Hardware in Hardware Kernel Project Settings view
- In the Assistant view, expand debug_system > debug_system_hw_link > Hardware
- Select binary_container_1, right-click and select Settings…
- In the binary_container_1 window, enter the following text of the V++ command line options: to enable ChipScope code insertion
-g --debug.chipscope KVAdd_1 -
Click OK and the string will appear as shown in marked 2
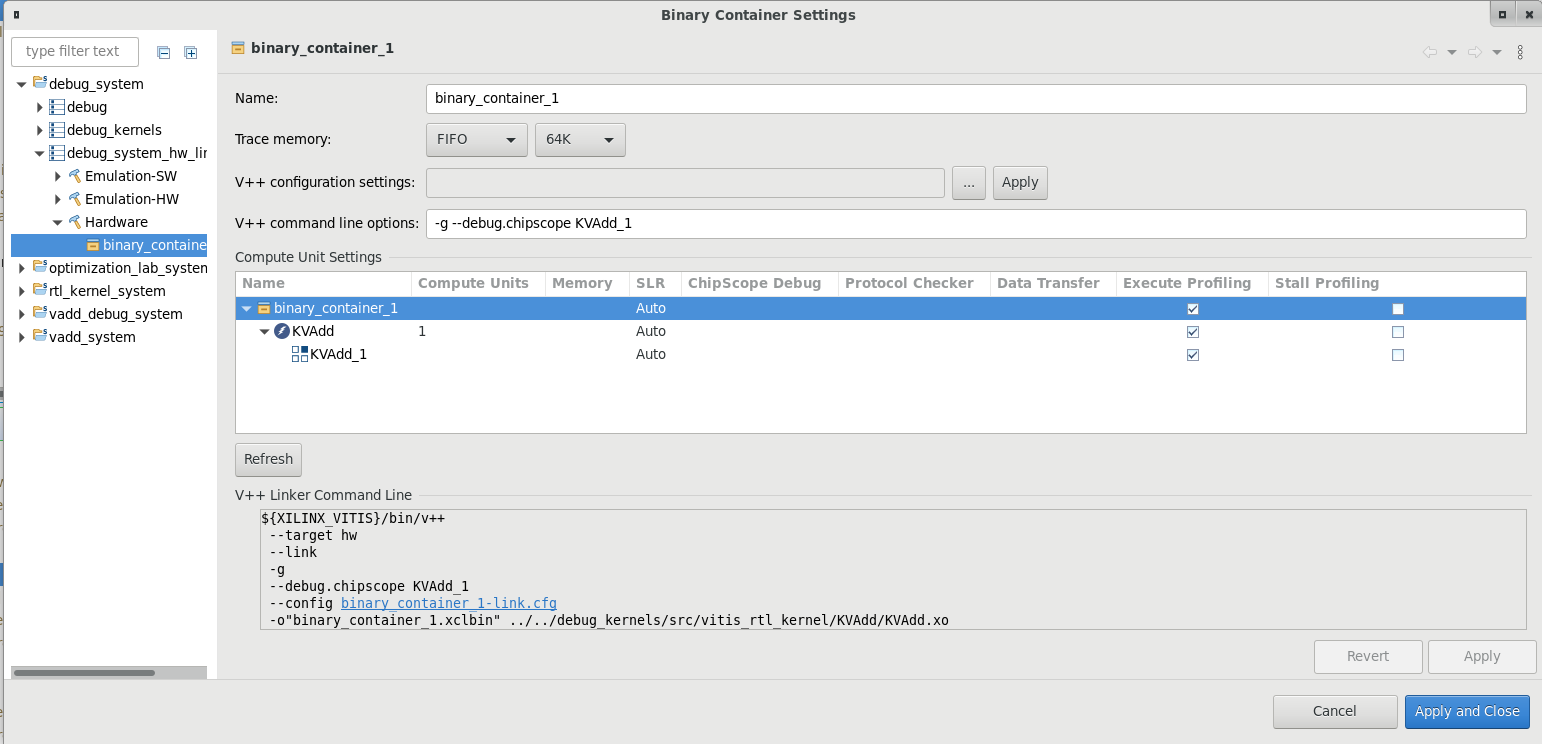
- Click Apply and close
- In the Explorer view, expand debug_system > debug > src and make sure that the host_example.cpp is present. If not then import it from debug_system > debug_kernels > src > vitis_rtl_kernel > KVAdd
- Double-click on the host_example.cpp from debug_system > debug > src to open it in the editor window
-
Around line 248 (after the clCreateKernel section) enter the following lines of code and save the file. This will pause the host software execution after creating kernel but before allocating buffer
printf("\nPress ENTER to continue after setting up ILA trigger...");
getc(stdin);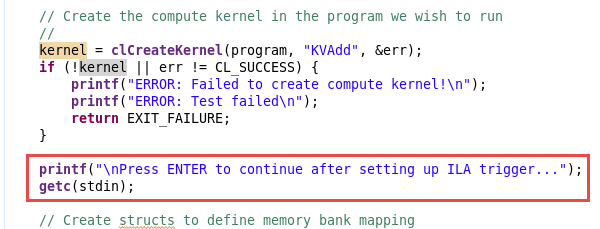
- Build the design
Copyright© 2021 Xilinx