Synthea Demo Overview
This section describes the structure and operation of the Synthea demo.
You can find its files under the Recommendation Engine installation
at /opt/xilinx/apps/graphanalytics/integration/Tigergraph-3.x/1.0/examples/synthea. Files mentioned
in the descriptions below are located relative to this directory unless otherwise stated.
Patient Data
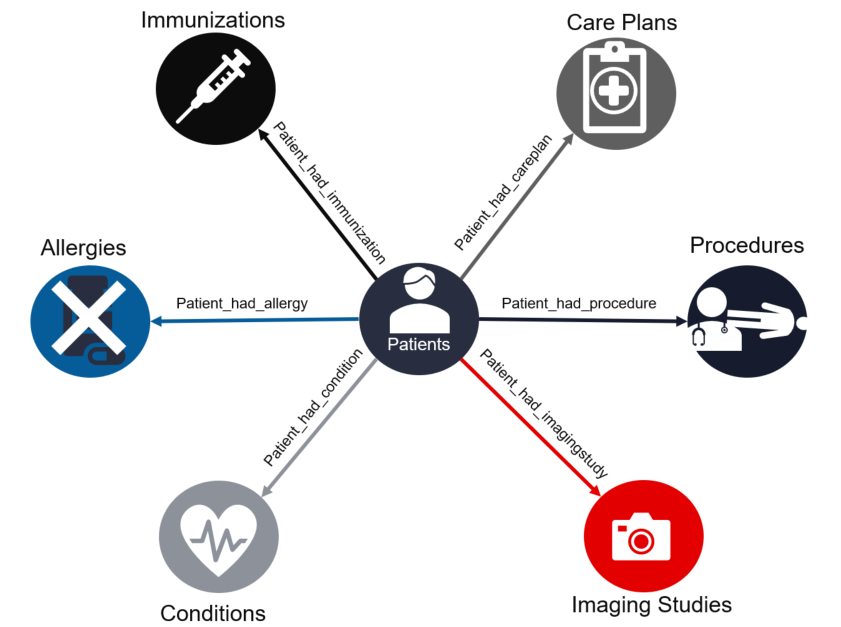
Synthea patient information and medical history are represented as vertices and edges in a TigerGraph graph as shown below:

To enable the cosine similarity algorithm to operate, each patient’s data is transformed into a vector of integers, called the patient vector, and stored into the patient vertex. The stored vector is called an embedding.
To form the patient vector, each scalar attribute, such as age, gender, race, and ethnicity, is mapped to a 32-bit signed integer value, called a _feature_, and becomes an element of the patient vector. Group attributes are transformed into a vector of features called a map. For example, the set of patient immunizations, which can vary in size from one patient to the next, are mapped to a map of 20 features in such a way that if two patients have similar sets of immunizations, the 20 features will have similar values.
In this demo each patient vector consists of 207 features, which are mapped from patient data as shown in the table below.
Feature (INT) |
Descriptions |
|---|---|
0 |
age |
1 |
gender |
2 |
race |
3 |
ethnicity |
4-16 |
reserved |
17-36 |
immunization map |
37-56 |
allergy map |
57-106 |
conditions map |
107-126 |
imaging studies map |
137-186 |
procedures map |
187-206 |
careplans map |
Demo Applications
TigerGraph applications communicate with TigerGraph primarily via a REST interface; that is, the applications make HTTP requests to the TigerGraph server, submitting in the details of that request which query to call and what arguments to pass to it. TigerGraph then operates on that request by running the specified query, then sends back the results of that query in JSON format as the HTTP response.
In addition to the REST API, TigerGraph provides a method for calling queries directly from a command line,
either using the supplied gsql command or the “Remote GSQL Client”, a Java module with a command-line interface.
This Synthea demo includes two applications: a simple, bash shell script using the direct-call method, and
a more elaborate REST-based Jupyter notebook that uses pyTigerGraph
to wrap basic HTTP requests in an TigerGraph-oriented Python API. The bash script, run.sh, can be found
in the demo directory, whereas the Jupyter demo is located in the jupyter-demo subdirectory.
Graph Setup Scripts
In a production environment, the graph and queries are installed outside of the application running on the data. However, to keep this demo simple, the demo applications have the responsibility of setting up the graph and queries.
To assist the demo applications in setting up the Synthea patient graph and queries, the applications call on a pair of bash shell scripts, both of which can be found in the demo install directory.
init_graph.sh: Sets up the graph and loads the Synthea data from its CSV filesinstall_query.sh: Installs the queries for this demo
Note: With TigerGraph, because queries depend on the graph schema, they must be installed after the graph, hence the need for an install_query.sh` script separate from the installation process of the demo itself.
Operation
This subsection describes how the client applications drive demo queries to execute cosine similarity operations in the Recommendation Engine. After this subsection, the following subsection describes the queries in detail.
The demo applications follow the same basic steps:
Set up the graph by running
init_graph.shInstall the demo queries by running
install_query.shCreate the embeddings
Load the embeddings into the Alveo accelerator card(s)
Run one or more a cosine similarity match operations on the Alveo card(s)
As the first two steps are standard for any TigerGraph configuration, the subsections below will focus on the remaining steps. The descriptions will refer to the diagram below, which shows the structure of the Synthea demo.
<structure diagram>
Create the Embeddings
<flow diagram>
The applications call the client_cosinesim_embed_vectors query to iterate over each patient, and for each patient,
fetch the patient’s details and history, compute the patient vector, and store the patient vector in the patient
vertex.
The query calls on a UDF installed with the demo, udf_get_similarity_vec, to calculate feature maps in C++ code.
Load the Alveo Card
<flow diagram>
The applications call the client_cosinesim_load_alveo query to collect the embeddings from the patient vertices
and send them to the Alveo card for storage.
Run a Match
<flow diagram>
Once the Alveo card is loaded with patient vectors, the applications can begin matching against that population
of vectors. The applications choose a patient at random to be the target vector, or in patient terms, the patient
sitting in the physician’s office. The applications then call the client_cosinesim_match_alveo query to run
the cosine similarity match in the Alveo card. The Alveo card, and subsequently the query, return the requested
number of top matching patients, along with their cosine similarity scores.