Calibration - Memory bandwidth and latency
Goal
xbtest compares bandwidth and latency measurements against limits.
This section will help you to define these limits (cu_bw & cu_latency) and find the optimal point which gives best results (maximum bandwidth with minimal latency).
The latency of the memory will depend on the request filling level of the AXI infrastructure (and memory controller).
There is a tipping point from which incrementing the quantity of write/read outstanding transactions doesn’t increase the bandwidth but does increase latency. Above this point, the access requests are queued in the AXI infrastructure (& memory controller), simply waiting to be served by the memory (as the memory operates at maximum capacity/bandwidth).
Few requests results in low latency but in lower bandwidth.
Too many requests mean highest bandwidth but high latency too.
The quantity of write/read outstanding transactions of the memory CU can be controlled by xbtest SW.
Best settings will be incorporated in the platform definition JSON file (cu_outstanding) and used as default settings during test.
In this example, you can see that:
x = 1, 2: when the outstanding transaction is low, read latency is low.
Outstanding transaction has a limited effect on the bandwidth. It only reduces the BW if there are big gaps in-between requests (longer than the actual data burst duration).
x = 1 -> 9: the latency increases with the quantity of outstanding transaction.
x > 9: the latency maxes out when all AXI infrastructure is full.
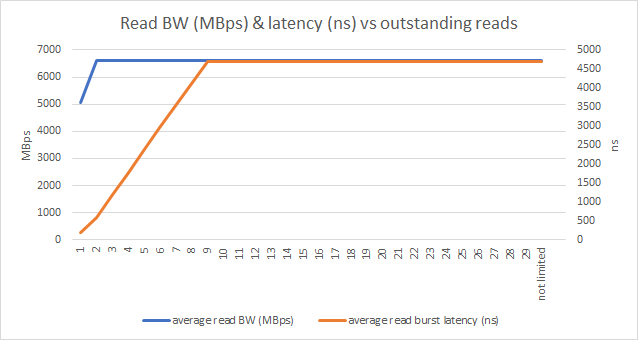
Read BW (MBps) and latency (ns) vs outstanding reads
Note
If the memory rate has been reduced drastically to avoid over-power, the outstanding control may have no influence on the latency as the bandwidth is so low that AXI infrastructure is never full.
This calibration is still required to get the bandwidth limits (and fill the platform definition JSON file).
General steps
Run the tests available to download. They all are memory tests with ramps of outstanding values (write & read outstanding requests are increasing gradually).
Save your results in section Calibration - Memory bandwidth and latency of your checklist and plot some graphs to easily find the optimal point.
Check where the memory reaches maximum bandwidth with the lowest latency.
Extract write/read bandwidths/latencies & outstanding settings.
Fill your platform definition JSON file with these figures.
FYI: by default, any memory test uses the outstanding and the bandwidth/latency limits defined in platform definition JSON file.
Margin
Outstanding: Select accordingly BW and latency.
Bandwidth/latency: xbtest SW takes automatically 10% margin around
averageBW and latency defined in platform definition JSON file.
Alternatively, you can also define
high/lowthresholds (see corner case below).
Don’t be afraid to round BW and latency threshold values.
Follow the steps below for all on-board memories present in your platform.
E.g. DDR, HBM, PS_DDR, PL_DDR.
Configuration corner cases
DMA thresholds configuration
DMA bandwidth high/low thresholds are automatically created based on PCIe speed of the card.
It can be overwritten if needed, for example, if the actual memory (or AXI infrastructure) BW is lower than PCIe capabilities.
Reduce speed for u25 PS_DDR:
"dma_bw": {
  "write": {
    "average": 3840
  },
  "read": {
    "average": 3840
  }
}
Reduce low threshold:
"dma_bw": {
  "write": {
    "low": 8000
  },
  "read": {
    "low": 8000
  }
}
P2P_NVME thresholds configuration
P2P_NVME bandwidth high/low thresholds are automatically created based on PCIe speed of the card.
It can be overwritten if needed, for example, if the actual memory (or AXI infrastructure) BW is lower than PCIe capabilities.
For example, reduce high threshold:
"p2p_nvme_bw": {
  "write": {
    "high": 8000
  },
  "read": {
    "high": 8000
  }
}
P2P_CARD thresholds configuration
P2P_CARD bandwidth high/low thresholds are automatically created based on PCIe speed of the card.
It can be overwritten if needed, for example, if the actual memory (or AXI infrastructure) BW is lower than PCIe capabilities.
For example, reduce high threshold:
"p2p_card_bw": {
  "write": {
    "high": 8000
  },
  "read": {
    "high": 8000
  }
}
Memory CU latency thresholds configuration
multi-channel memory (e.g. HBM, PS_DDR or Versal NOC DDR) may have more complex connection.
Some access points to the memory could be shared between CU and shell infrastructure (e.g. DMA engine).
E.g. Pseudo-channel HBM[12] is also used as PCIe hook point.
Therefore, latency might be bigger/lower for some memory CU channels.
In such case, you can’t use a single average limit.
You need to fully define the range of the latency from best- and worst-case figures across all channels:
high: 30% above highest latency across all channels.
low: 30% below lower latency across all channels.
Example of definition of the memory CU latency high and low thresholds:
"cu_latency": {
  "only_wr": {
    "write": {
      "high": 156,
      "low" : 56
    }
  },
  "only_rd": {
    "read": {
      "high": 319,
      "low" : 138
    }
  },
  "simul_wr_rd": {
    "write": {
      "high": 156,
      "low" : 56
    },
    "read": {
      "high": 358,
      "low" : 154
    }
  }
}
Host memory configuration
Host memory doesn’t require a calibration. You can used default value as it is accessed over PCIe and it’s too much dependent on the server used.
It will be easier to use a test JSON file defining outstanding, with (or not) latency thresholds and enable their checks.
Fixed HOST memory settings can be used:
No
cu_outstanding.
It’s impossible to define a value that will work for all servers.
cu_ratefor memory test modeonly_wrset to:
50 % for platform with PCIe 3x16.
12 % for 3x4 platform.
cu_bwbased on the PCIe speed (see examples below):
high = 256 MBps * 2pcie_speed-1 * pcie_width.
low = 25 % of high.Latency are using loose range.
3x16 & 4x8 PCIe |
3x4 PCIe |
|---|---|
 "memory" : {
   "0" : {
     "name" : "HOST",
     "cu_rate": {
       "only_wr": {
         "write": {
           "nominal" : 50
         }
       }
     },
     "cu_bw": {
       "only_wr": {
         "write": {
           "high": 16000,
           "low" : 4000
         }
       },
       "only_rd": {
         "read": {
           "high": 16000,
           "low" : 4000
         }
       },
       "simul_wr_rd": {
         "write": {
           "high": 16000,
           "low" : 4000
         },
         "read": {
           "high": 16000,
           "low" : 4000
         }
       }
     },
     "cu_latency": {
       "only_wr": {
         "write": {
           "high": 6000,
           "low" : 1
         }
       },
       "only_rd": {
         "read": {
           "high": 6000,
           "low" : 1
         }
       },
       "simul_wr_rd": {
         "write": {
           "high": 6000,
           "low" : 1
         },
         "read": {
           "high": 6000,
           "low" : 1
         }
       }
     }
   }
 }
|
 "memory": {
   "0": {
     "name": "HOST",
     "cu_rate": {
       "only_wr": {
         "write": {
           "nominal" : 12
         }
       }
     },
     "cu_bw": {
       "only_wr": {
         "write": {
           "high": 4000,
           "low" : 1000
         }
       },
       "only_rd": {
         "read": {
           "high": 4000,
           "low" : 1000
         }
       },
       "simul_wr_rd": {
         "write": {
           "high": 4000,
           "low" : 1000
         },
         "read": {
           "high": 4000,
           "low" : 1000
         }
       }
     },
     "cu_latency": {
       "only_wr": {
         "write": {
           "high": 6000,
           "low" : 1
         }
       },
       "only_rd": {
         "read": {
           "high": 6000,
           "low" : 1
         }
       },
       "simul_wr_rd": {
         "write": {
           "high": 6000,
           "low" : 1
         },
         "read": {
           "high": 6000,
           "low" : 1
         }
       }
     }
   }
 }
|
Memory simultaneous_wr_rd QoS
The memory Quality of Service (QoS) can also be controlled by the rate. You can define rate to balance read and write bandwidth during simultaneous access.
During simultaneous_wr_rd access, the read and write BW may be identical but it’s not simple relationship from the only_wr or only_rd measurements.
It’s recommended to always define the simultaneous bandwidth.
DDR QoS |
HBM QoS |
Host QoS |
||||
|---|---|---|---|---|---|---|
The current DDR controller is balancing write and read BW when read and write access are performed simultaneously. DDRs are faster to read than to write, resulting in a write BW quite lower.
So even if "cu_bw": {
"only_wr": {
"write": {
"average": 15200
}
},
"only_rd": {
"read": {
"average": 17200
}
},
"simul_wr_rd": {
"write": {
"average": 8500
},
"read": {
"average": 8500
}
}
}
|
HBM sub-system & controller currently balance access to reduce latency. This results in a higher write bandwidth which could be rectified by using a reduce write rate. It’s not mandatory. In this example, with a If you use default Warning Selected rate should be compliant with the previous rate calibration (see Calibration - Memory CU power) 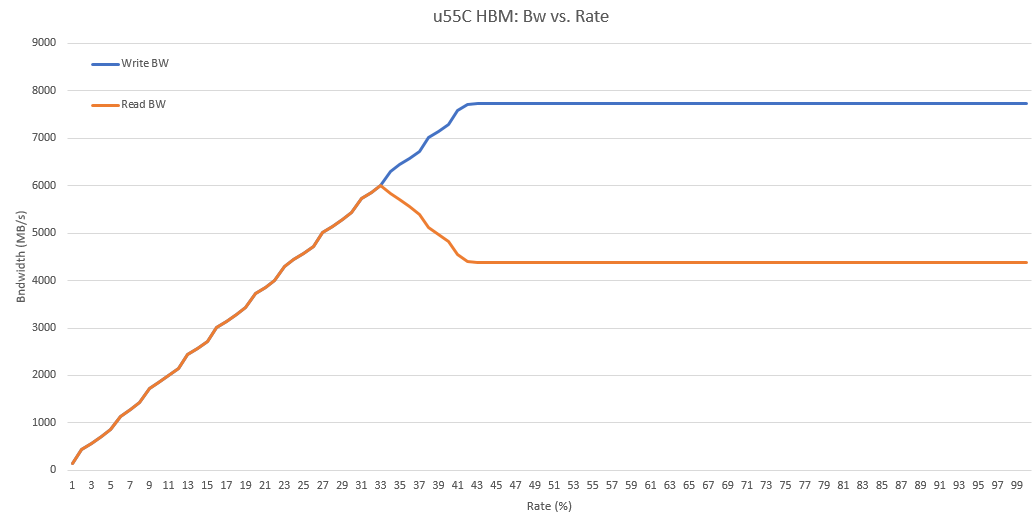
u55c HBM BW vs. memory CU rate
|
The memory CU is sending traffic to the host over the Slave bridge. The current Slave bridge implementation doesn’t include any QoS. Knowing that PCIe write are posted, this results in a write-bias bandwidth. Rate can be used to balance read/write access. In this case, selects a rate of 45 %. It’s not recommended as Host tests are heavily depending on the PCIe architecture of the server. For host memory, do not define rate for QoS purpose. Let the user select the best rate according to his test environment. 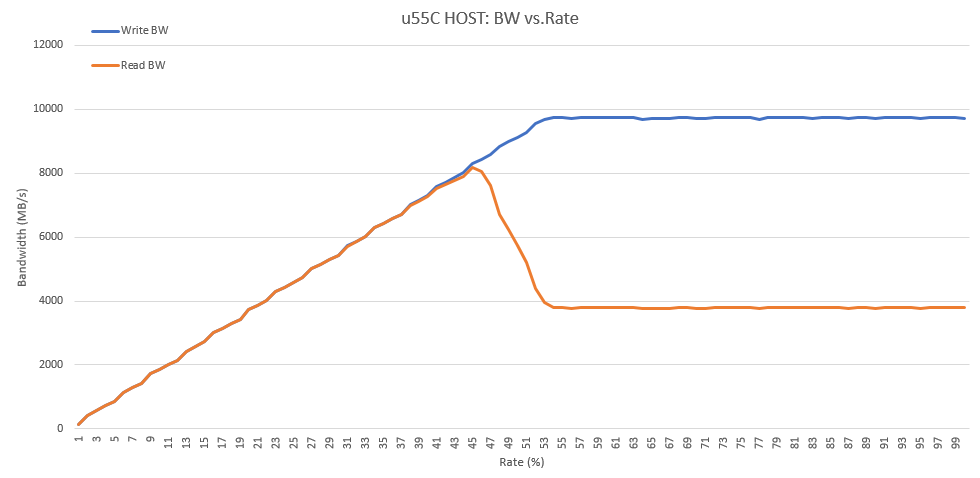
u55c host memory BW vs. memory CU rate¶ |
TO-DO
For all on-board memory types (e.g. HBM, DDR, PS_DDR, PL_DDR):
Follow Detailed steps section.
Use the example provided as reference.
Add your results to section Calibration - Memory bandwidth and latency of your checklist.
Warning
Host memory doesn’t require any calibration; use the recommended settings, see Host memory configuration.
Detailed steps
Nominal read rates, maximum number of outstanding transactions, BW thresholds and latency thresholds must be defined in the platform definition JSON file. xbtest SW can still run with the default values present in the platform definition JSON file template.
Follow the calibration steps to optimize and characterize your memory and to be able to fill the platform definition JSON file. To ease your task, test JSON files have been provided for the most common types of memory (DDR and HBM). If your memory is not one of them, you’ll need to update the test JSON files accordingly.
Step |
Description |
|---|---|
Step 1 |
Find the value of the maximum number of outstanding transactions providing the best latency and BW performances. For each on-board memory type:
|
Step 1.a |
For QoS of Important If you’ve already reduced the rates due to power restriction (Calibration - Memory CU power), you must skip this Step 1.a and you can re-use the results. $ xbtest -F -d <bdf> -j simultaneous_wr_rd_qos_rate_ramp_ddr.json -l simultaneous_wr_rd_qos_rate_ramp_ddr
$ xbtest -F -d <bdf> -j simultaneous_wr_rd_qos_rate_ramp_hbm.json -l simultaneous_wr_rd_qos_rate_ramp_hbm
Here is the test file: Zip the log directory and attach it to this checklist: $ zip -r simultaneous_wr_rd_qos_rate_ramp_ddr.zip simultaneous_wr_rd_qos_rate_ramp_ddr
$ zip -r simultaneous_wr_rd_qos_rate_ramp_hbm.zip simultaneous_wr_rd_qos_rate_ramp_hbm
|
Step 1.b |
Set It could be that the write and read bandwidths stay similar throughout the entire ramp (typically with DDR),
in this case, you don’t define any Important If you’ve already reduced the rates due to power restriction (Calibration - Memory CU power), make sure that you select rates below the maximum supported. |
Step 1.c |
Now that QoS is achieved, you can run the $ xbtest -F -d <bdf> -j simultaneous_wr_rd_outstanding_ramp_ddr.json -l simultaneous_wr_rd_outstanding_ramp_ddr
$ xbtest -F -d <bdf> -j simultaneous_wr_rd_outstanding_ramp_hbm.json -l simultaneous_wr_rd_outstanding_ramp_hbm
Here is the test file: Zip the log directory and attach it to this checklist: $ zip -r simultaneous_wr_rd_outstanding_ramp_ddr.zip simultaneous_wr_rd_outstanding_ramp_ddr
$ zip -r simultaneous_wr_rd_outstanding_ramp_hbm.zip simultaneous_wr_rd_outstanding_ramp_hbm
|
Step 1.b |
For test mode: $ xbtest -F -d <bdf> -j only_rd_outstanding_ramp_ddr.json -l only_rd_outstanding_ramp_ddr
$ xbtest -F -d <bdf> -j only_rd_outstanding_ramp_hbm.json -l only_rd_outstanding_ramp_hbm
Here is the test file:
Zip the log directory and attach it to this checklist: $ zip -r only_rd_outstanding_ramp_ddr.zip only_rd_outstanding_ramp_ddr
$ zip -r only_rd_outstanding_ramp_hbm.zip only_rd_outstanding_ramp_hbm
|
Step 1.c |
For test mode: $ xbtest -F -d <bdf> -j only_wr_outstanding_ramp_ddr.json -l only_wr_outstanding_ramp_ddr
$ xbtest -F -d <bdf> -j only_wr_outstanding_ramp_hbm.json -l only_wr_outstanding_ramp_hbm
Here is the test file:
Zip the log directory and attach it to this checklist: $ zip -r only_wr_outstanding_ramp_ddr.zip only_wr_outstanding_ramp_ddr
$ zip -r only_wr_outstanding_ramp_hbm.zip only_wr_outstanding_ramp_hbm
|
Step 2 |
Report memory CU calibration results (multi-channel: for 1 channel only, single-channel for 1 CU only): BW and latency graphs and run directory ZIP files in Calibration - Memory bandwidth and latency section. Determine nominal
Note BW and latency measured with this setting as you’ll use them to fill the platform definition JSON file. |
Step 3 |
Set |
Step 4 |
Set |
Step 5 |
Set |
Results and analysis
Graph
For each test run, add the following graphs to section Calibration - Memory bandwidth and latency of your checklist.
Find the memory log file:
For single-channel:
<log_dir>/memory_<tag>_result.csv, e.g.simultaneous_wr_rd_outstanding/memory_ddr[0]_result.csv.For multi-channel:
<log_dir>/memory_<tag>_ch_0_result.csv, e.g.simultaneous_wr_rd_outstanding/memory_hbm[0]_ch_0_result.csv.For PS_DDR, need to look at all channels and combined results:
<log_dir>/memory_DDR[1]_ch_<id>_result.csv.
E.g.
simultaneous_wr_rd_outstanding/memory_PS_DDR_mc_summary.csv.E.g.
simultaneous_wr_rd_outstanding/memory_PS_DDR_mc_summary.csv.
Then:
Open it in Excel.
For
simultaneous_wr_rd_rate_rampruns:
Remove first rows where
test_mode=only_wras it contains results coming from the initialization of the memory (prior the actual readings).Create graph (2-D line) with
average total write+read BW (MBps),average write BW (MBps)andaverage read BW (MBps).
Use data of
read rate (%)column for horizontal axis.Set chart title to: BW vs CU rate for <memory_type> <test_mode>.
Set axis titles with data units.
Create graph (2-D line) with
write burst latency (ns).
Use data of
read rate (%)column for horizontal axis.Set chart title to: Write latency vs CU rate for <memory_type> <test_mode>.
Set axis titles with data units.
Create similar graph but with
read burst latency (ns).For
simultaneous_wr_rd_outstanding_rampandonly_rd_outstanding_rampruns:
remove first rows where
test_mode=only_wr. as it contains results coming from the initialization of the memory (prior the actual readings).Create graph (2-D line) with
average read BW (MBps)andaverage read burst latency (ns).
Use data of
outstanding readscolumn for horizontal axis.
Note outstanding set to 0 corresponds to a maximum number of outstanding transactions not limited.
Use primary vertical axis for bandwidth.
Use secondary vertical axis for latency.
Set chart title to: Read BW & latency vs outstanding reads for <memory_type> <test_mode>.
Set axis titles with data units.
Create similar graph but with
average write BW (MBps)andaverage write burst latency (ns).
Include these graphs to your Checklist Template.
Results
Add your results to section Calibration - Memory bandwidth and latency of your checklist.