Result visualisation
Most of the test cases produce csv file, you can use it to create figures and graphs according to your need. xbtest produces another set of files which can be used directly by Vitis Analyzer in order to create default graphs. Default graphs depends on the test case run but they could be:
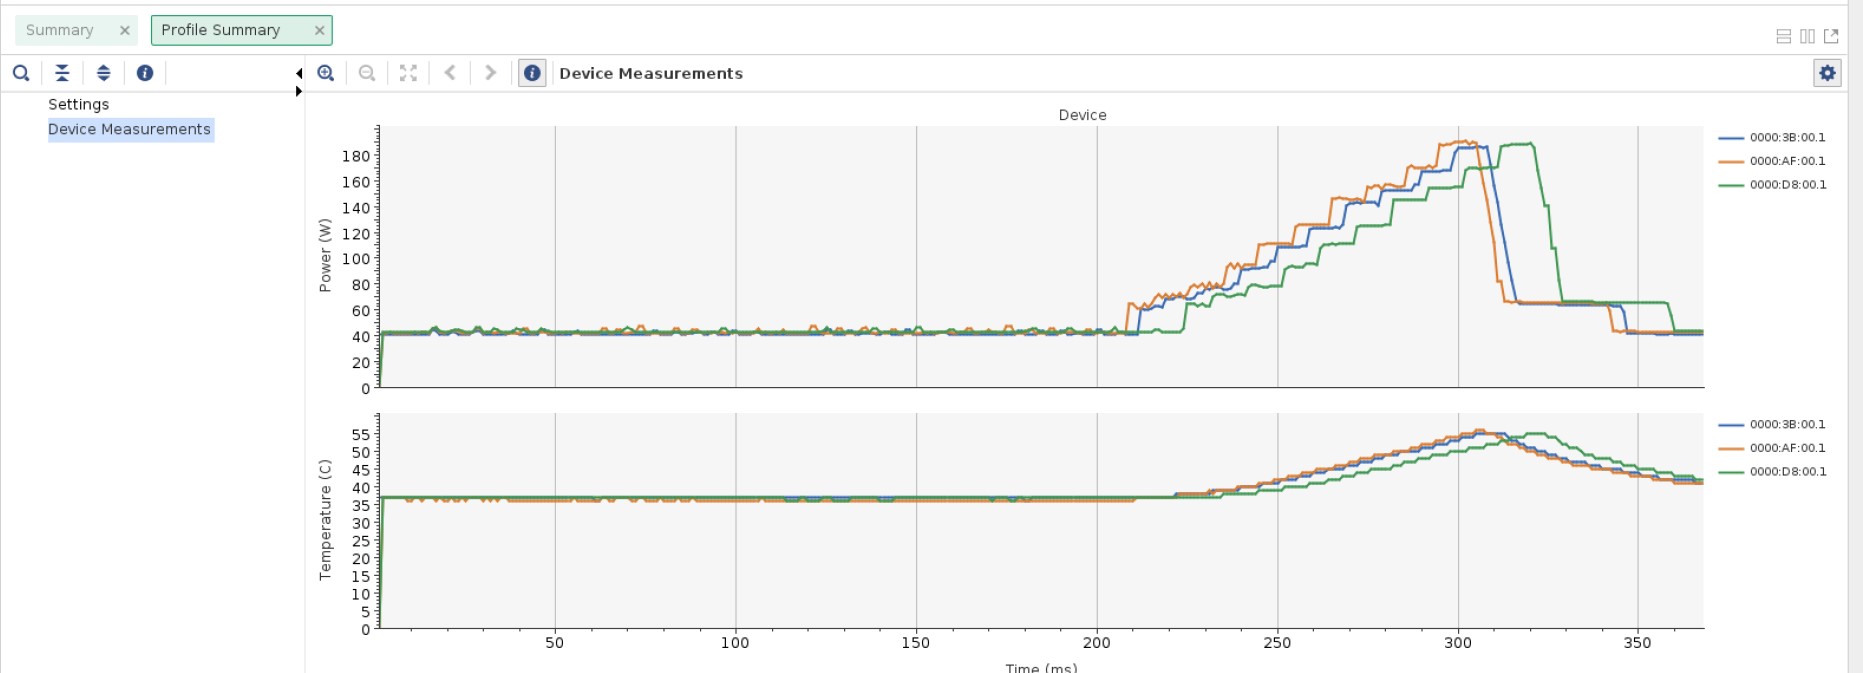
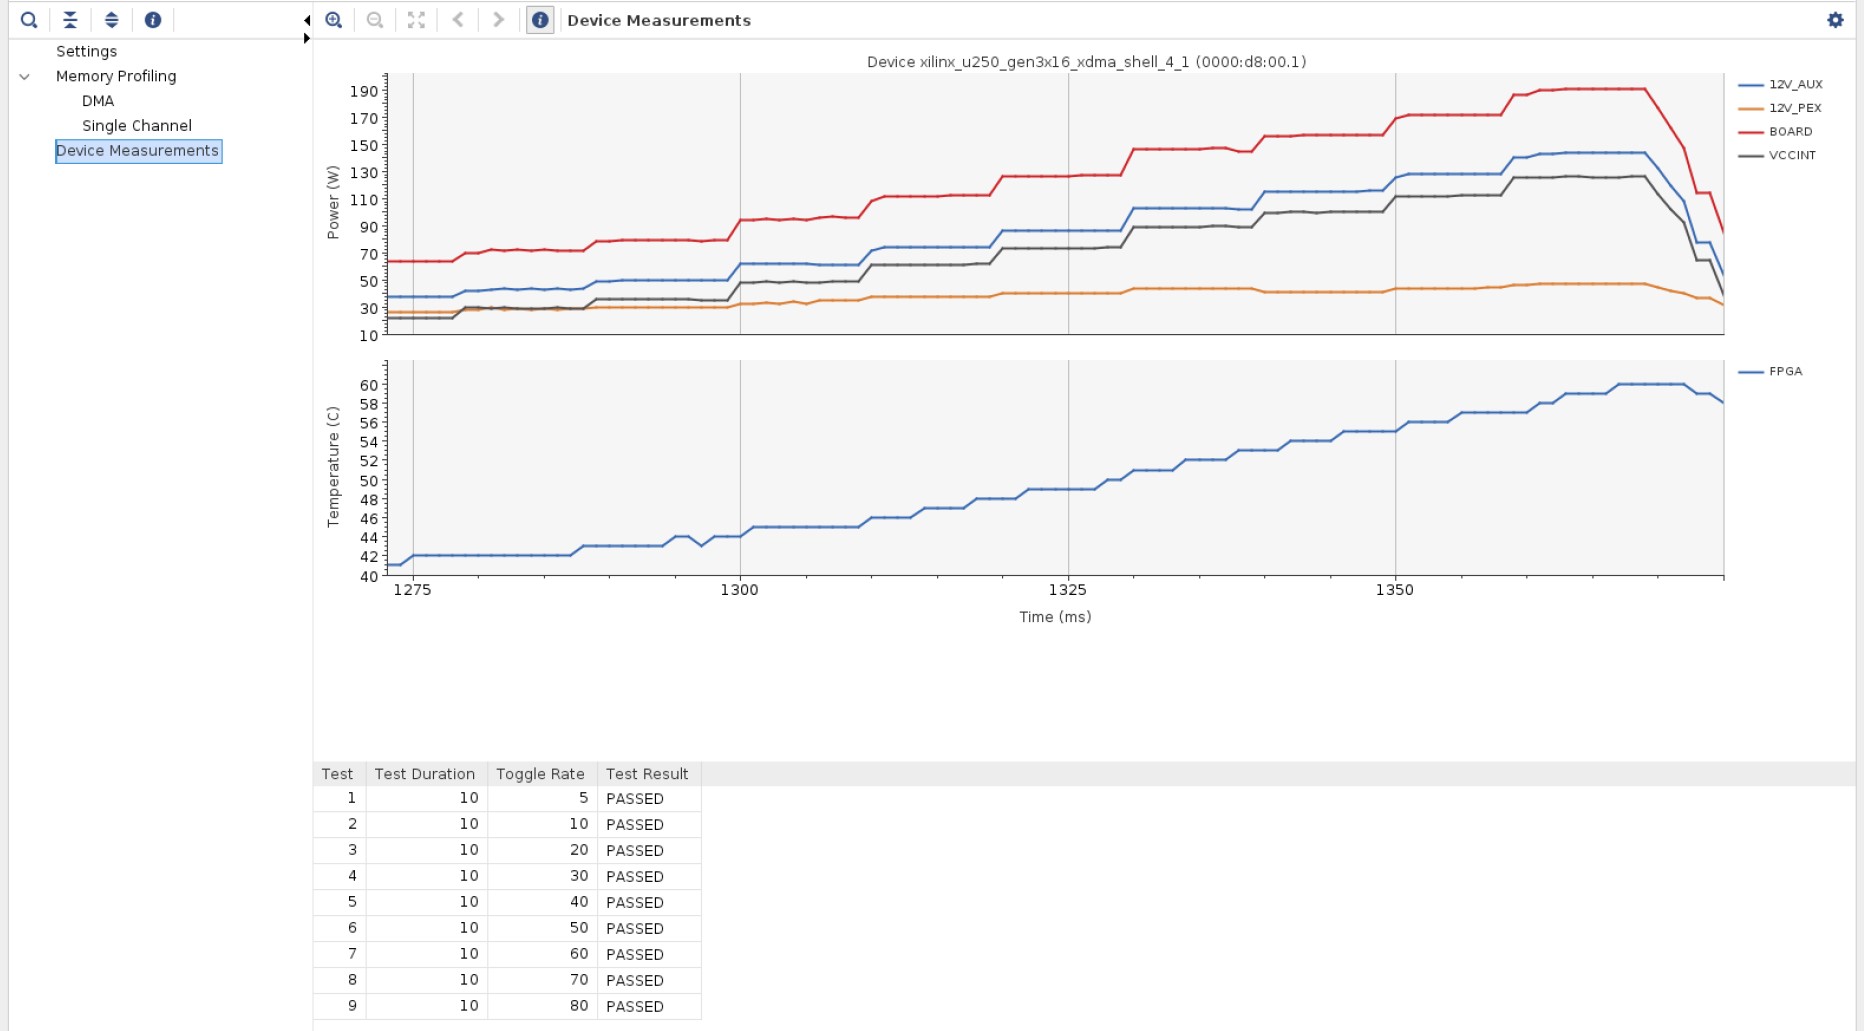
Power, temperature and toggle rate when Power CU is used.
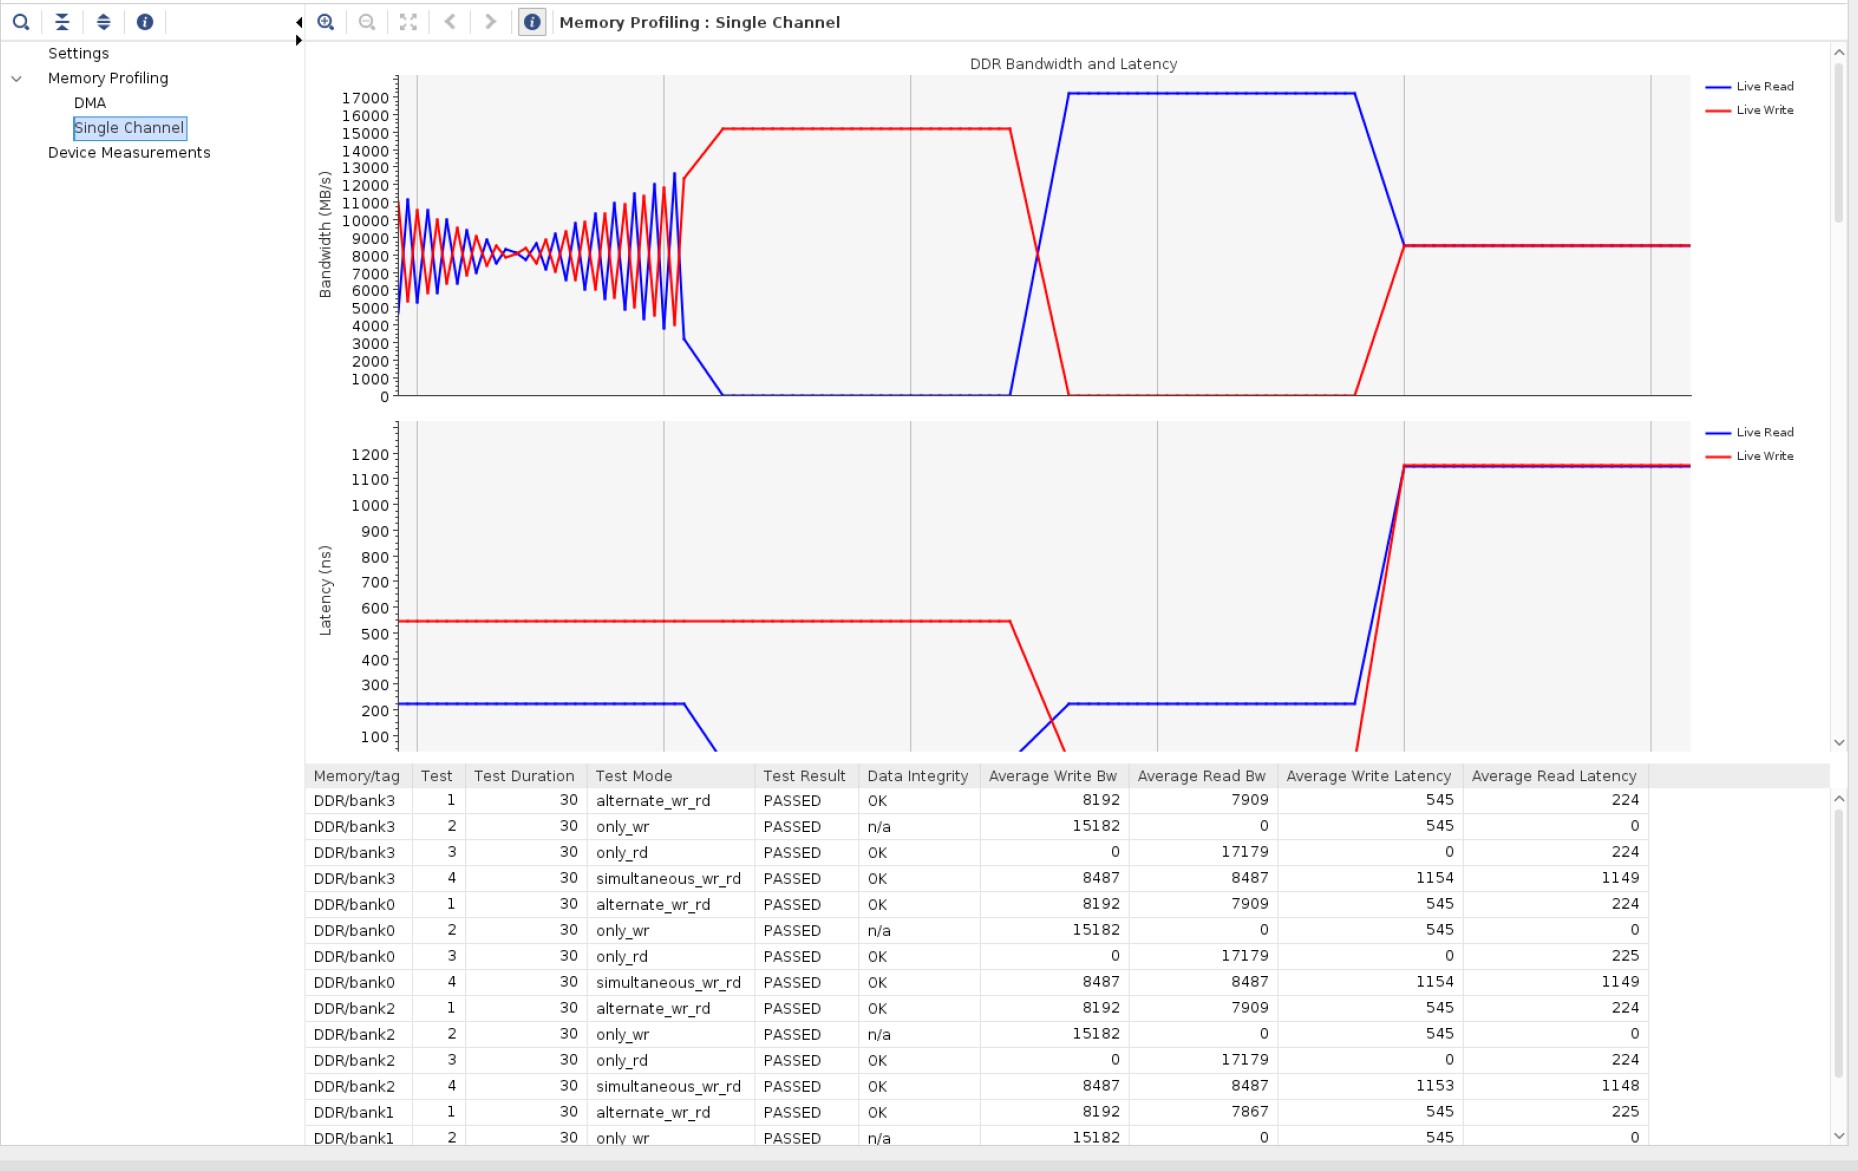
Bandwidth and latency for any memory test: DMA, P2P, Memory CU (HOST, DDR, HBM …).
Vitis analyzer also present the results of all tests in a table. It also adds colour and severity sorting of the xbtest messages present in log file.
Note
In multi cards mode, at the top of these individual test graphs, it’s possible to create a single graph displaying the power and temperature of all cards.
If the logging is enabled, an extra VA folder will be generated within the logging folder (see Result directory). The content of this VA folder also depends on the type of xbtest run (single or multi card test).
Single card test files (Single test result directory):
xbtest.run_summary: used by Vitis Analyzer to configure the various graphs.xbtest.log: identical content to the xbtest.log file present in logging folder but with level of severity compatible with the Vitis Analyzer. Vitis Analyzer only supports:Error: this will group xbtest Failure and Error.
Critical Warning: same as xbtest Critical Warning.
Warning: same as xbtest Warning.
Info: same as xbtest Info.
Status: this will group xbtest Status and Pass
summary.csv: this is not strictly speaking a csv file. It contains various sections:Information about xbtest run itself: date, time, platform …
DMA test result: it will be used to display a summary table along the bandwidth graph
Power test result: it will be used to display a summary table along the power, temperature and toggle rate graphs
Memory test result: it will be used to display a summary table along the bandwidth and latencies graphs
memory_dma.csv: dma measurements
power.csv: temperature and power measurements. It also includes the toggle rate.
memory
TAG.csv: bandwidths and latency measurements for theTAGmemory
Multi card test files (Single test result directory):
xbtest.run_summary: used by Vitis Analyzer to configure the various graphs.xbtest.log: identical content to the multi card log file present in logging folder but with level of severity compatible with the Vitis Analyzer. Vitis Analyzer only supports:Error: this will group xbtest Failure and Error.
Critical Warning: same as xbtest Critical Warning.
Warning: same as xbtest Warning.
Info: same as xbtest Info.
Status: this will group xbtest Status and Pass
summary.csv: this is not strictly speaking a csv file. For multi card, its content is limited (date, time …)card_power.csv: temperature and power measurements for each card.
Vitis analyzer
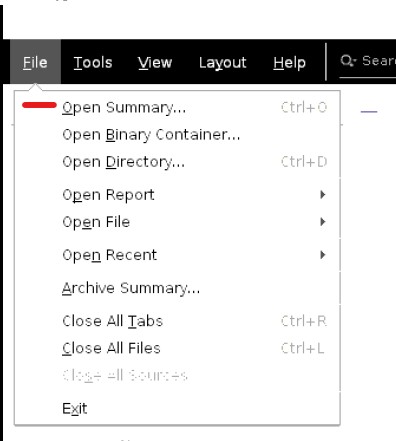
You need to access to Vitis Analyzer version 2022.1 (or more recent). Once Vitis Analyser opened, from the File Drop menu, click on Open Summary. Select the xbtest.run_summary present in the VA folder of the logging directory corresponding to the xbtest run that you want to analyse and display the results.
Whatever the test type (single or multi card), Vitis Analyzer allows you to select 3 kinds of reports
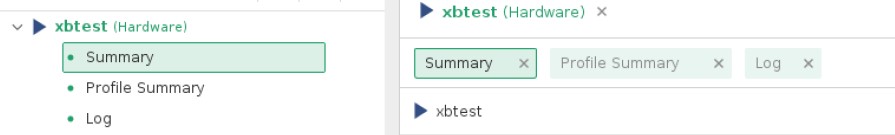
The following sections are available:
Summary: date, card, duration …
Profile Summary: plots and table of results
Log: xbtest log file
Profile summary
With single card test, based on the test case run, you can have different plots (+ table of results)
DMA: bandwidth.
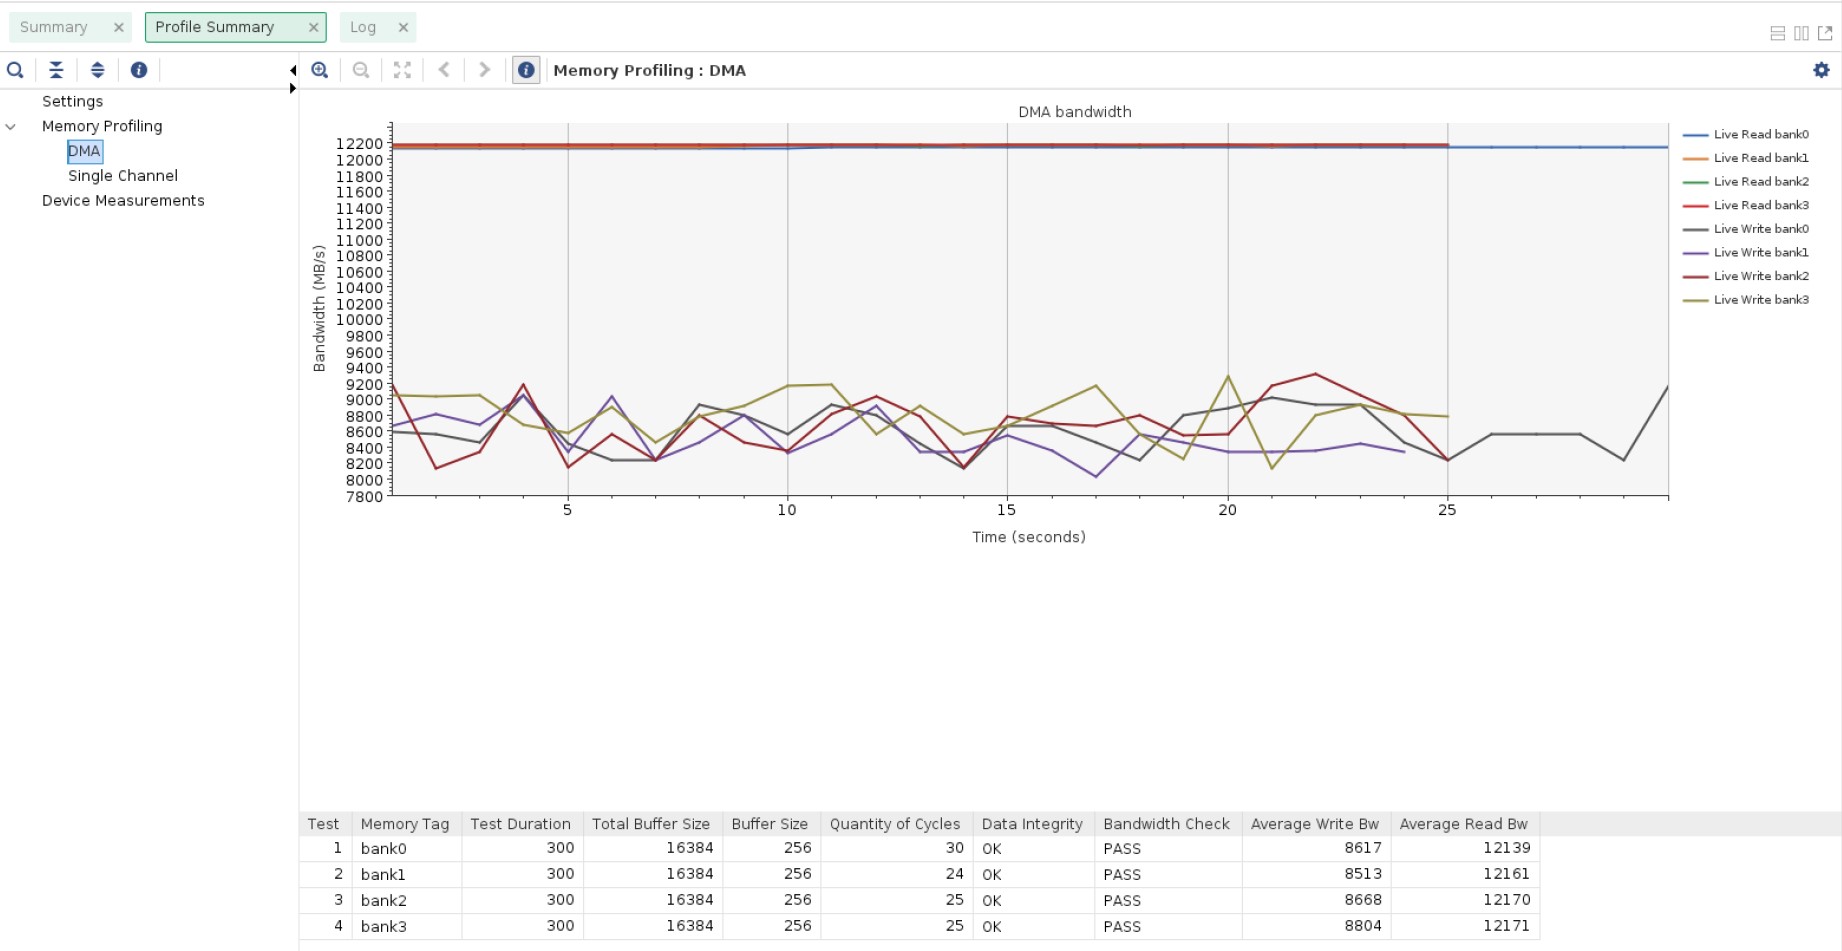
Memory: Bandwidth and latency for single-channel memory (typically DDR) or Multi Channel (HBM).
Device Measurements: power and temperature (& toggle rate).
With multi card test, there is only type of plot: power and temperature. You can select via the BDF which card you want to display. By default, there are all displayed.