Internal Design of Dense Similarity
Interface
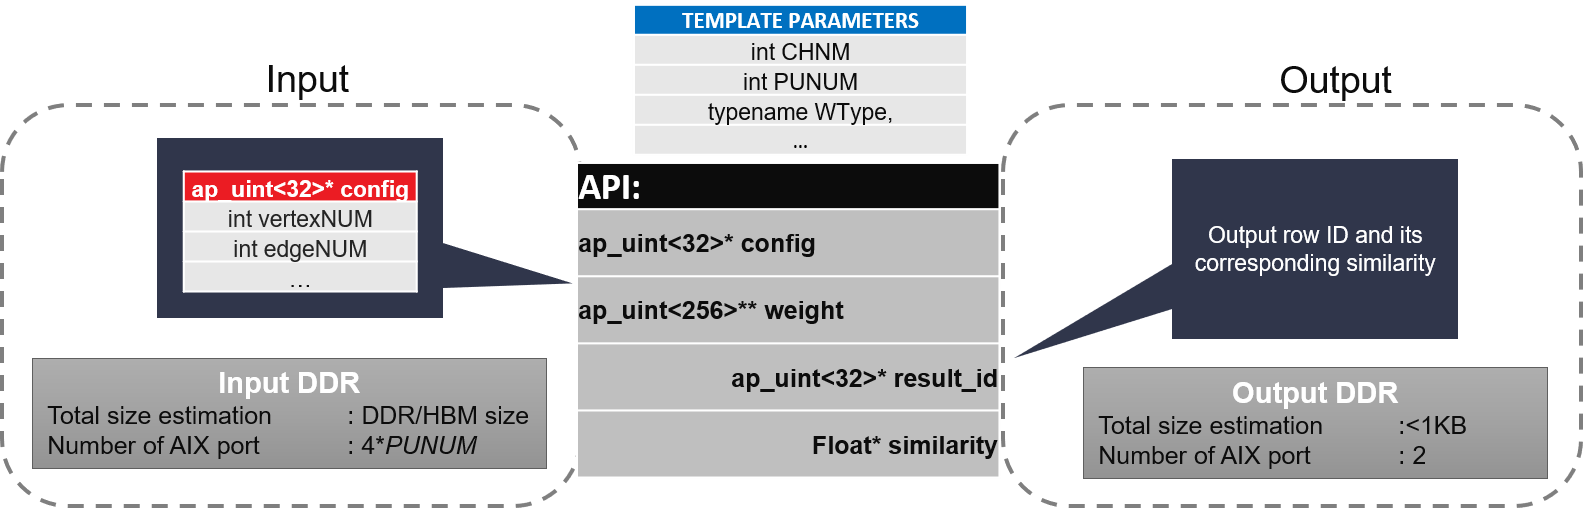
The input should be a set of vertex list with known size. The result will return a vertex list with each vertex corresponding similarity value. The config contains several boolean value to control the similarityType (0:Jaccard Similarity, 1:Cosine Similarity), dataType(0:uint32, 1:float, 2:uint64, 3:double, 4:int32, 5:int64). There are two dense similarity primitives are provided in the library. One can perform the computation of both uint and float, and it takes almost twice resource consumption compared with the other dense similarity primitive which can only support integer as its input. For interger version of dense similarity, there is a design of 2-CU instantiation to get the best performance on the platform of U50.
Implemention
The detail algorithm implemention is illustrated as below:
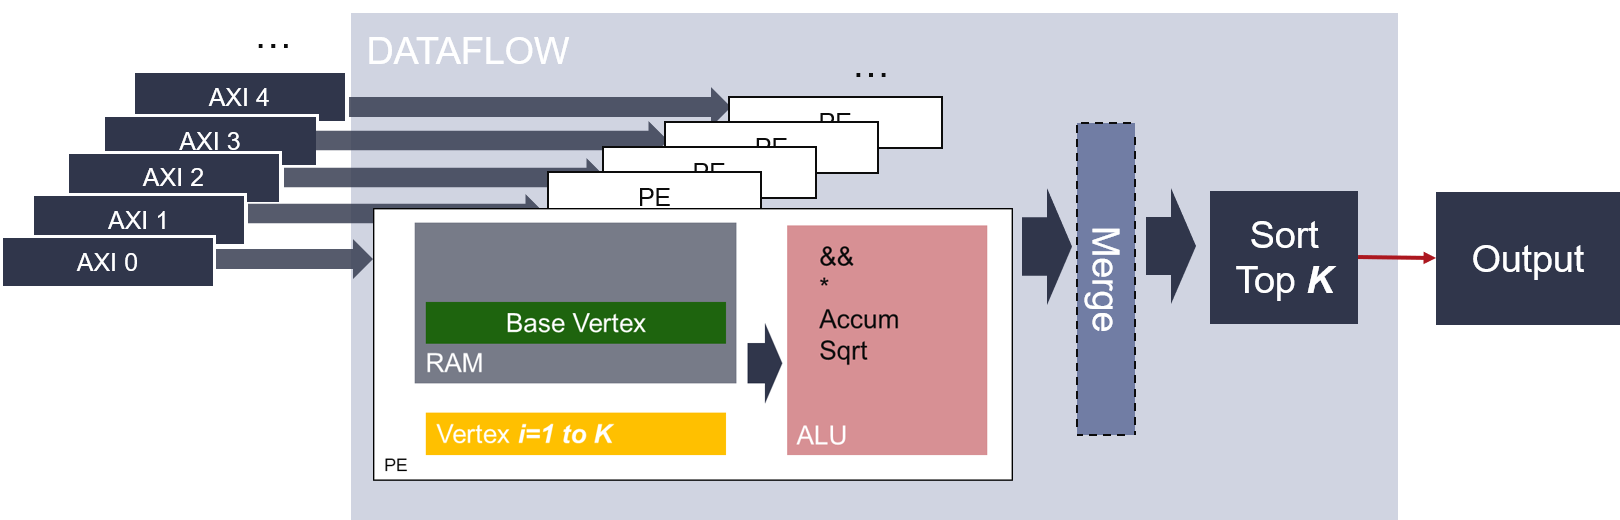
In the calculation of dense similarity, most of internal loop size is set by the config variables, so that the reference vertex is alligned with others. The calculation is simpler than Sparse Similarity Kernel. In the uint + float version, uint input will be transformed to float by primitive internal logic, then, all the calculation is using float arethmatics. In the integer version, the 32-bit input will be accumulated by 64-bit registers, and the output float similarity is divide result of two 64-bit integers. The overall diagram of dense similarity kernel have a insert sort module which return the top K number of similarity values. The maximum number of K is a template number which can be changed by rebuilding the xclbin. The default value of top K is 32.
Profiling and Benchmarks
The Dense Similarity Kernel is validated on Alveo U50 board at 260MHz frequency. The hardware resource utilization and benchmark results are shown in the two table below.
| Name | LUT | Register | BRAM | URAM | DSP |
|
221256 | 329187 | 402 | 16 | 1273 |
|
134446 | 160671 | 402 | 16 | 807 |
|
272521 | 333259 | 618 | 48 | 2364 |
| Datasets | Vertex | Edges | Similarity Type | FPGA Time / ms | TigerGraph (32 core 512 GB) | |
| Time / ms | Speed up | |||||
| Patients(1 GB) | 1250000 | 200 | Cosine | 11.2 | 585.7 | 52.3 |
Note