Internal Design of General Similarity
Interface
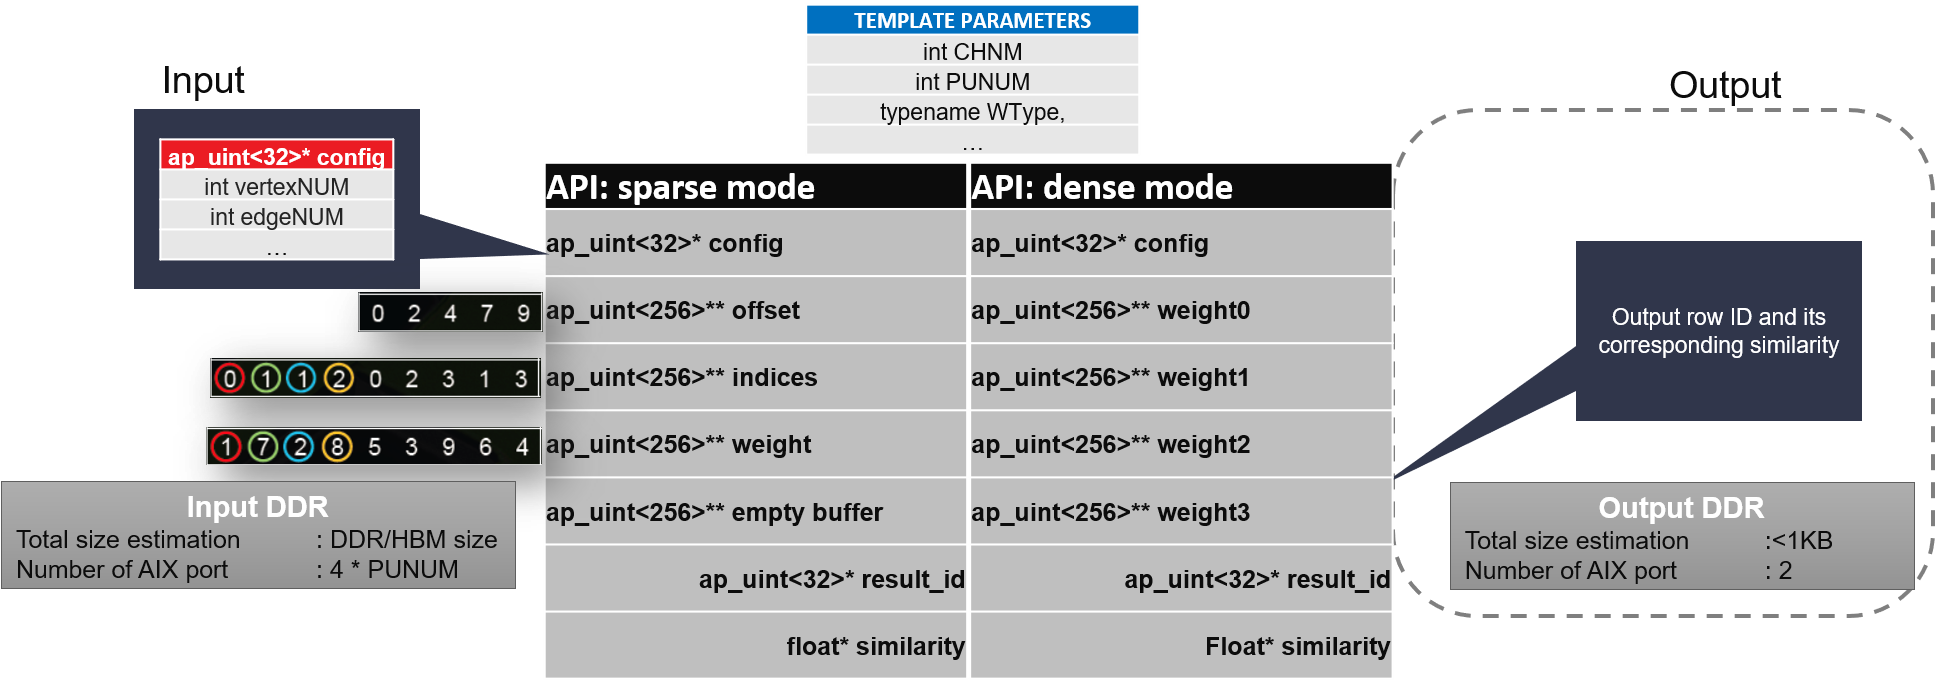
This primitive support both dense and sparse mode. In sparse mode, the input should be a undirected graph in compressed sparse row (CSR) format with its vertex and edge numbers. In desnse mode, the input should be a set of vertex list with known size. The result will return a vertex list with each vertex corresponding similarity value. The config contains several boolean value to control the graphType (0:Sparse Mode, 1:Dense Mode), similarityType (0:Jaccard Similarity, 1:Cosine Similarity), dataType (0:uint, 1:float).
Implemention
The detail algorithm implemention is illustrated as below:
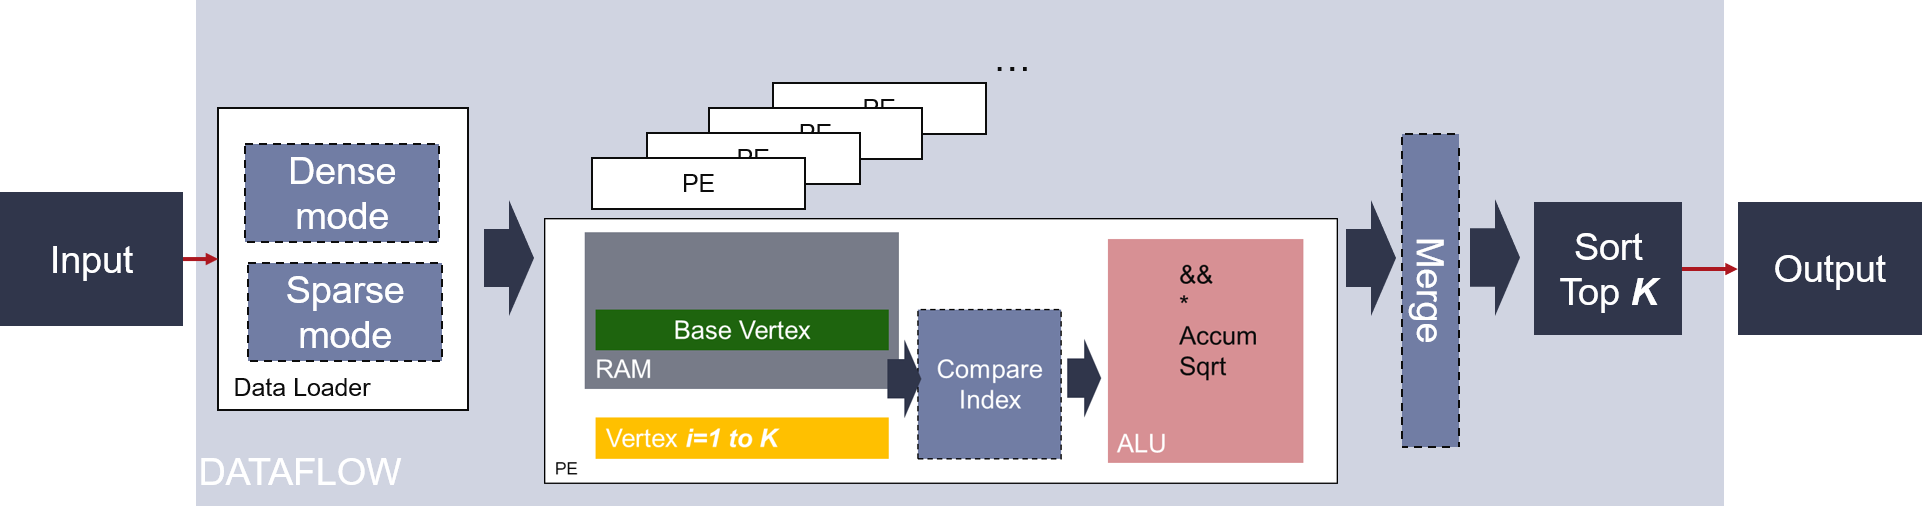
General Similarity contains most of modules in Sparse Similarity and Dense Similarity. It have two DataLoader which can process sparse and dense input by config. It is shown in the aboved API picture, each PE have four AXI port to store input data. For sparse mode, each PE have 3 valid AXI input which are corresponding to offset, indice and weight, so that there is a dangling port. In dense mode, the partitioned weight data are stored in each AXI and it can better improve the data loading speed which can significantly impact the finnal performance. After DataLoader, the input data is transform to COO stream internally so that it can share most of calculation logic between dense and sparse mode. The overall diagram of general similarity kernel have a insert sort module which return the top K number of similarity values. The maximum number of K is a template number which can be changed by rebuilding the xclbin. The default value of top K is 32.
Profiling and Benchmarks
The General Similarity Kernel is validated on Alveo U50 board at 295MHz frequency. The hardware resource utilization and benchmark results are shown in the two table below.
| Name | LUT | Register | BRAM | URAM | DSP |
| generalSimilarityKernel | 168516 | 230995 | 230.5 | 80 | 645 |
| Datasets | Vertex | Edges | Similarity Type | FPGA Time / ms | TigerGraph (32 core 512 GB) | |
| Time / ms | Speed up | |||||
| as-Skitter | 1694616 | 11094209 | Cosine | 21.3 | 278 | 13.5 |
| Jaccard | 21.2 | 271 | 12.7 | |||
| coPaperDBLP | 540486 | 15245729 | Cosine | 24.4 | 289 | 11.8 |
| Jaccard | 24.5 | 271 | 11.0 | |||
| coPaperCiteseer | 434102 | 16036720 | Cosine | 30.6 | 282 | 9.2 |
| Jaccard | 30.7 | 283 | 9.2 | |||
| cit-Patents | 3774768 | 16518948 | Cosine | 35.3 | 268 | 7.6 |
| Jaccard | 35.1 | 262 | 7.5 | |||
| europe_osm | 50912018 | 54054660 | Cosine | 188.4 | 309 | 1.6 |
| Jaccard | 188.3 | 315 | 1.7 | |||
| hollywood | 1139905 | 57515616 | Cosine | 110.3 | 280 | 2.6 |
| Jaccard | 110.1 | 329 | 3.0 | |||
| soc-LiveJournal1 | 4847571 | 68993773 | Cosine | 105.2 | 293 | 2.8 |
| Jaccard | 105.3 | 288 | 2.7 | |||
| ljournal-2008 | 5363260 | 79023142 | Cosine | 120.6 | 281 | 2.4 |
| Jaccard | 120.5 | 384 | 3.2 | |||
| GEOMEAN | 79.4 | 292.7 | 3.70 | |||
| Datasets | Vertex | Edges | Similarity Type | FPGA Time / ms | TigerGraph (32 core 512 GB) | |
| Time / ms | Speed up | |||||
| Patients(1 GB) | 1250000 | 200 | Cosine | 22.1 | 585.7 | 26.5 |
Note