Internal Design of Single Source Shortest Path
Overview
Single Source Shortest Path is the problem of finding the shortest path from a source vertex to all other vertices in a graph.
Algorithm
The implemented Single Source Shortest Path is based on Bellman-Ford algorithm equiped with a First-In-First-Out queue. Below is the pseudo-code of the algorithm:
procedure SingleSourceShortestPath(graph, source)
for each vertex v in graph
    distance(v) := positive infinity

distance(source) := 0
push source into Q
while Q is not empty
    u := pop Q
    for each edge(u,v) in graph
        if distance(u) + weight(u,v) < d(v) then
            distance(v) := distance(u) + weight(u,v)
            push v into Q
        end if
    end for
end while

return distance
Here, graph is a graph with a list of vertices and a list of weighted edges. source is the start vertex of the algorithm. Q is a first-in-first-out queue. And the distance is iterated during the algorithms and returned as the result.
Interface
The input should be a directed graph in compressed sparse row (CSR) format. The result is an array which shows the shortest distance from the source vertex to each vertex. The vertex ID can be used to index of the result array.
Implementation
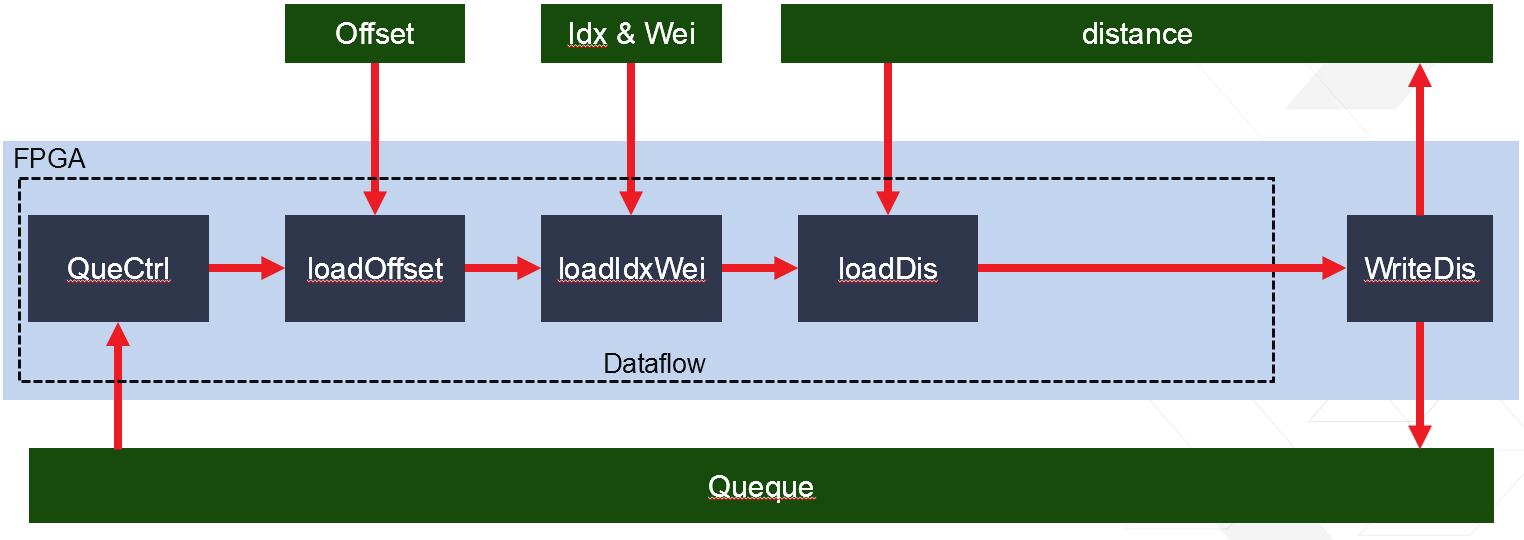
The algorithm implemention is shown in the figure below:

There are 5 functional blocks as shown in the figure:
- QueCtrl is responsible to load the next vertex in the queue and pass it to the loadOffset.
- loadOffset load the offset value associate with current vertex from the CSR offset values and pass it to the next block.
- loadCol&Wei load the ID and weight of the next hop vertices accroding to the offset values. And pass these IDs and weights to the loadRes.
- loadRes load the distance of the next hop vertices already in the result and calculate the new distance and decide whether the distance of every next hop vertex should be updated.
- WriteRes update all the distances to the new value and push all the updated vertices into the queue.
This system starts from pushing the source vertex into the queue and iterate until the queue is empty.
Profiling
The hardware resource utilizations are listed in the following table.

The performance is shown below.

Note 1: Tigergraph running on platform with Intel(R) Xeon(R) CPU E5-2640 v3 @2.60GHz.